

In this post, I’ll focus on setups that I’m monitoring for both long and short positions. With a chart and short write-up, this is a quick way to scan and plan potential trades.
These ideas are the end result of my process to identify stocks offering the right combination of growth fundamentals along with a proper chart setup.
Stock Market Update
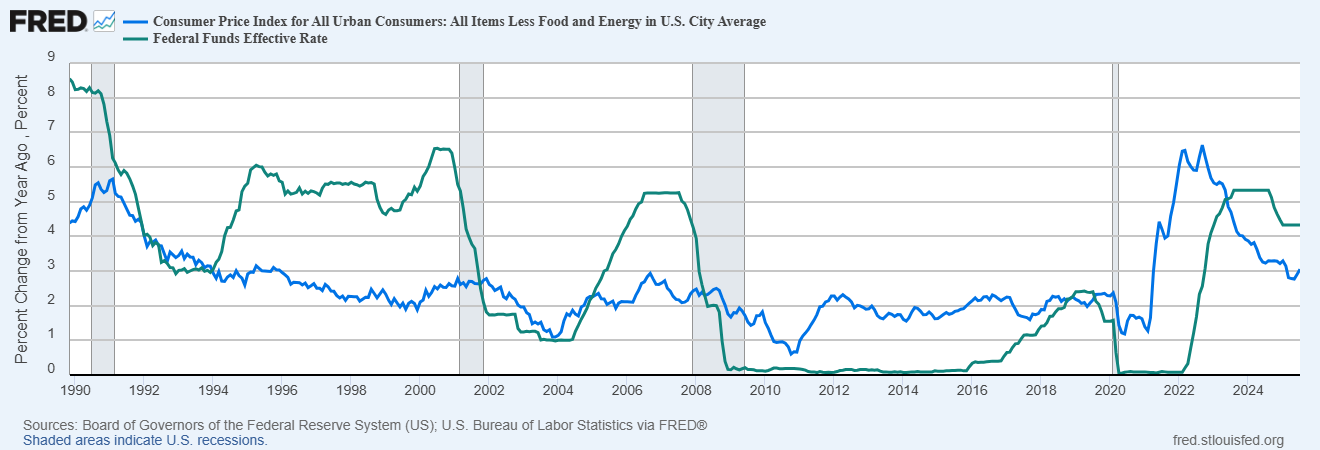
Minutes of the Federal Reserve’s last rate-setting meeting showed a broadening consensus over risks to the inflation outlook. The minutes noted that the majority of FOMC members saw upside to inflation outweighing employment risk. While it’s worth noting that the last Fed meeting occurred just before July’s weak payrolls report, subsequent consumer and producer inflation measures are also accelerating. The chart below shows the effective fed funds rate (green line) against the year-over-year rate of change in core CPI. With core CPI rising toward fed funds in recent months, that sets up a highly anticipated speech by Fed Chair Jerome Powell at the Jackson Hole symposium on Friday. Powell has used the venue in previous years to broadcast key pivots on monetary policy. If concerns over inflation continue to outweigh risks to the labor market, Powell could temper expectations for any rate cuts at upcoming meetings until more data is gathered.
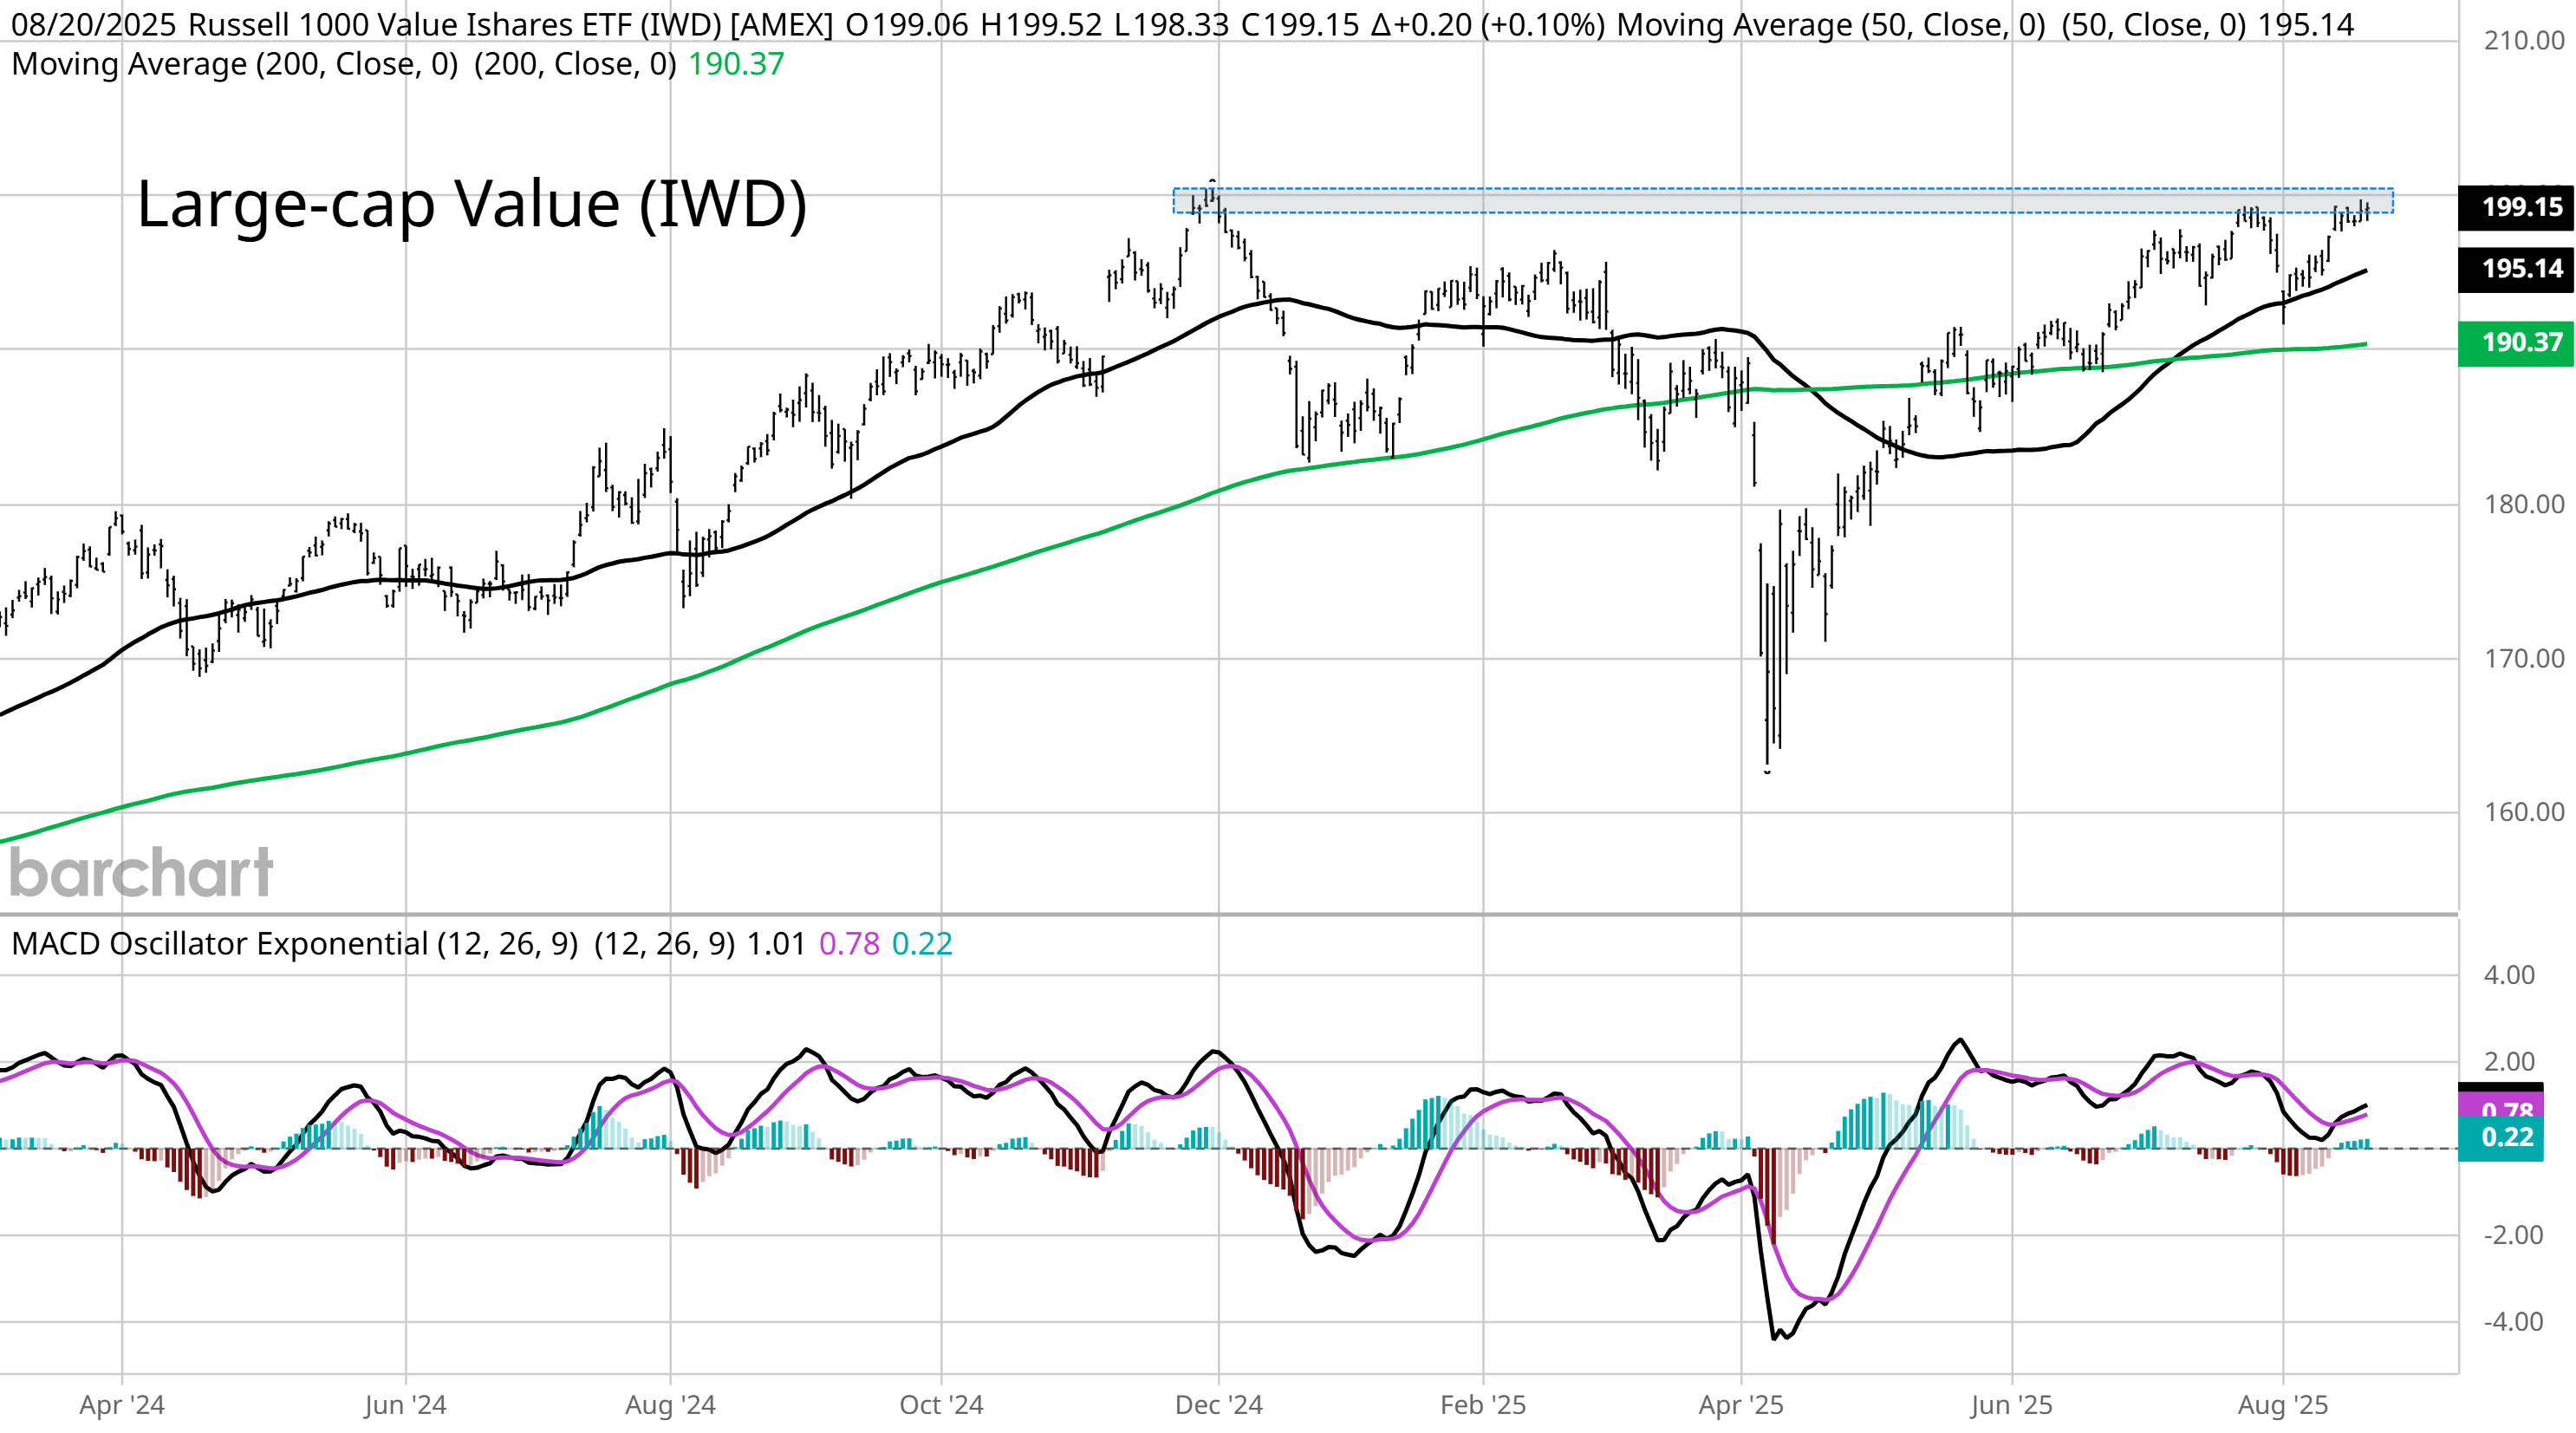
Uncertainty over the outlook for inflation and interest rate cuts is happening alongside recent weakness in the major stock indexes. The S&P 500 has fallen as much as 2% from the recent high this week, which lines up with post-election year seasonal weakness into the start of October. But the pullback masks strength happening under the hood. While growth stocks are dragging the indexes lower, measures of the average stock are holding up. We’re also seeing a rotation into the value side of the market, with the iShares Russell 1000 Value ETF (IWD) continuing to rally off a test of the 50-day moving average (black line). IWD is nearing a breakout to new highs over the $200 level.
Here’s one way to use the pullback in growth stocks to your advantage. Look for stocks showing constructive action by forming the right side of their base with a smaller pullback. And stocks that are barely reacting are showing relative strength, which points to accumulation. With that in mind, we have several potential new leaders to add to the watchlist this week. Keep reading to see:
Open ETF positions.
Open stock positions.
Chart analysis for new trade ideas.
