In this post, I’ll focus on setups that I’m monitoring for both long and short positions. With a chart and short write-up, this is a quick way to scan and plan potential trades.
These ideas are the end result of my process to identify stocks offering the right combination of growth fundamentals along with a proper chart setup.
***Become a member of the Traders Hub to unlock access to the Stock Trading and ETF Investment Portfolios!***
I believe the next major bull market phase is underway. Our open positions include high growth stocks, a play on Bitcoin, and other cyclical sectors already breaking out.
Come and join us at the Hub as we ride the bull trend!
Stock Market Update
Investors continue digesting the aftermath of the election and subsequent cabinet picks from President-elect Donald Trump that will shape key policies impacting the economy and stock market. At the same time, recent comments from Federal Reserve Chair Jerome Powell is tempering expectations on the speed and magnitude of further interest rate cuts. That’s led to volatility across the major indexes, many of which are filling gaps left after the election.
The chart below of the iShares Russell 2000 ETF (IWM) that tracks small-caps is a good example of a gap fill and back test of support. Heading into the elections, IWM formed a bullish ascending triangle pattern shown with the dashed trendlines. It’s worth noting that pattern also developed just below the prior all-time highs (which you will see taking the chart back further). IWM gapped out of that pattern to new record highs following the election. Since then, price is pulling back which is “filling the gap” and back testing resistance from the triangle pattern that is now support around the $230 level. Back tests and gap fills are quite common, while price should not fall back into the pattern. The MACD and RSI are also seeing bullish momentum resets.
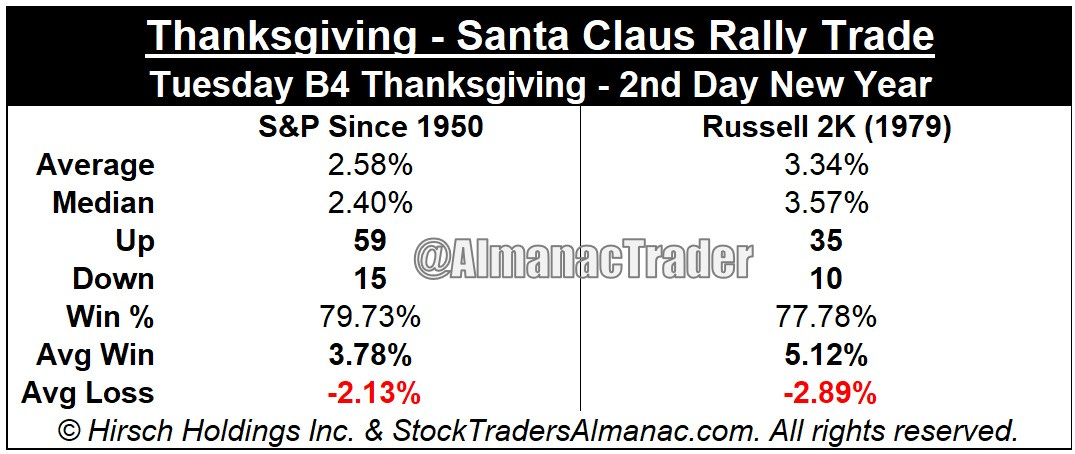
There are several tailwinds that could support a rebound into year-end across the major stock indexes. Bitcoin’s breakout over $70,000 and rally to fresh record highs is a major “risk-on” signal. High-yield ETFs like JNK and HYG are hovering near their highs, while financial conditions are trending looser overall. Both developments are bullish for risk sentiment as well. We’re also coming up on a favorable stretch of seasonality. The table below shows the historical performance of the S&P 500 and Russell 2000 Index from the Tuesday before Thanksgiving through the Santa Claus rally that lasts to the second day of the New Year. Historical win rates for the period are just below 80%, with an average gain of 2.5% for large-caps and 3.3% for small-caps.

Keep reading below to see our model portfolio of open positions and chart analysis for new trade ideas.


