

In this post, I’ll focus on setups that I’m monitoring for both long and short positions. With a chart and short write-up, this is a quick way to scan and plan potential trades.
These ideas are the end result of my process to identify stocks offering the right combination of growth fundamentals along with a proper chart setup.
Here are my notes from a focus list of setups I’m monitoring.
📢Before jumping into today’s chart report, I’m preparing to launch a new premium feature:
Mosaic Traders Hub
The Hub goes live on 10/28, and you can read all the details of what’s included here (plus several new features).
If you enjoy Mosaic Chart Alerts, then you’re going to love the Hub! You can reserve your spot by pledging today.
Stock Market Update
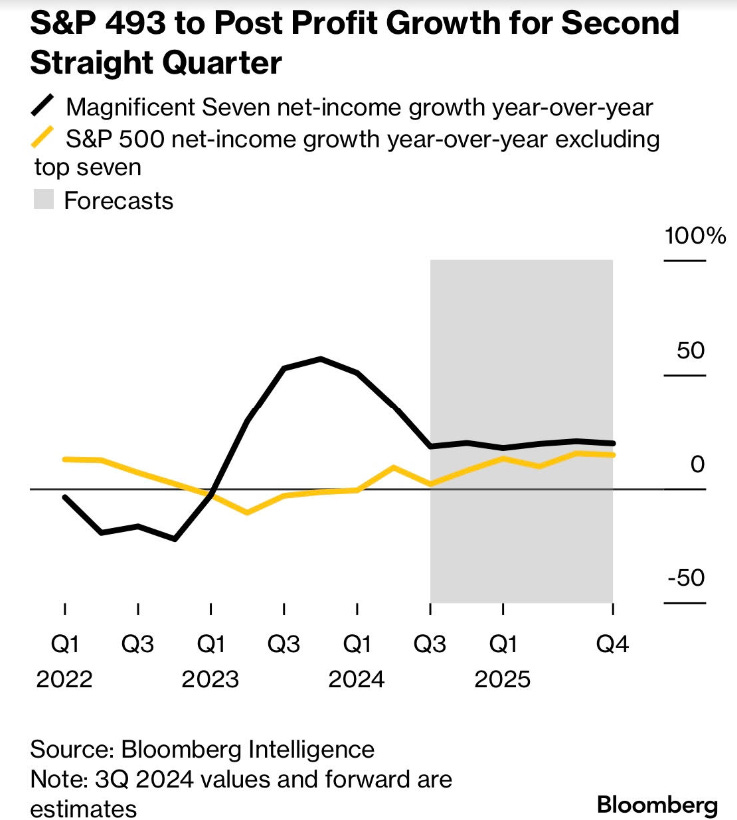
As investors digest recent labor market and inflation data, the outlook for the magnitude and pace of interest rate cuts by the Federal Reserve looks uncertain. But instead guessing where short-term rates are going, investors should be assessing the earnings outlook. That’s because once the Fed starts an easing cycle, the ultimate path of the S&P 500 depends on the economy avoiding recession and the ensuing impact on corporate earnings. With the third quarter earnings season underway, projections show earnings growth broadening beyond the “Magnificent 7”. That’s especially important for the average stock, where ongoing earnings growth is need to support the rally. The chart below shows year-over-year net income growth for the Mag 7 (black line) and the remaining 493 companies (yellow line) in the S&P 500. You can see that earnings growth among the average stock is inflecting higher, and projected to catchup with the Mag 7 into next year.
Those projections for better earnings across the average stock depends on a growing economy. And the economic outlook is being supported by an expansion in breakouts across cyclical sectors sensitive to activity. I recently noted the setup in the KBE bank sector exchange-traded fund (ETF). KBE is now breaking out above a key resistance level as I noted here. But it doesn’t stop there. The past week is seeing breakouts from sectors like transports as well as mid- and small-cap stocks that are more sensitive to developments with the domestic economy (relative to large-caps that on average receive a large share of revenues from international sources). The weekly chart below shows the IYT transportation ETF. Transports peaked back in 2021, and has since tested resistance at the $70 level several times. Over the past week, price is building on a breakout over that level and comes as the weekly MACD is in the early stages of turning higher from the zero line.

While the prospect for election cycle volatility remains, it’s hard to be anything but bullish on the longer-term outlook when cyclical sectors are breaking out from lengthy consolidation patterns. The move higher in mid- and small-caps is also starting to erase the recent negative breadth condition, where short-term breadth was lagging the price action in the major indexes. For this week, I’m removing CYBR from watch as the stock holds above its breakout level. I also have a new addition to the watchlist.
Keep reading below for all the updates…
Long Trade Setups
OPXS
Peaked near the $8.50 level in May and setting up in a new consolidation pattern. Series of smaller pullbacks following a test of resistance on four occasions. Would like to see a MACD reset at zero before a move over $8.50.

TSM
Consolidating the prior uptrend since peaking in July around $190. Making a series of smaller pullbacks as price is now testing resistance again at $190. Recent MACD reset at the zero line while the relative strength (RS) line remains near the high. Watching for a breakout over $195.

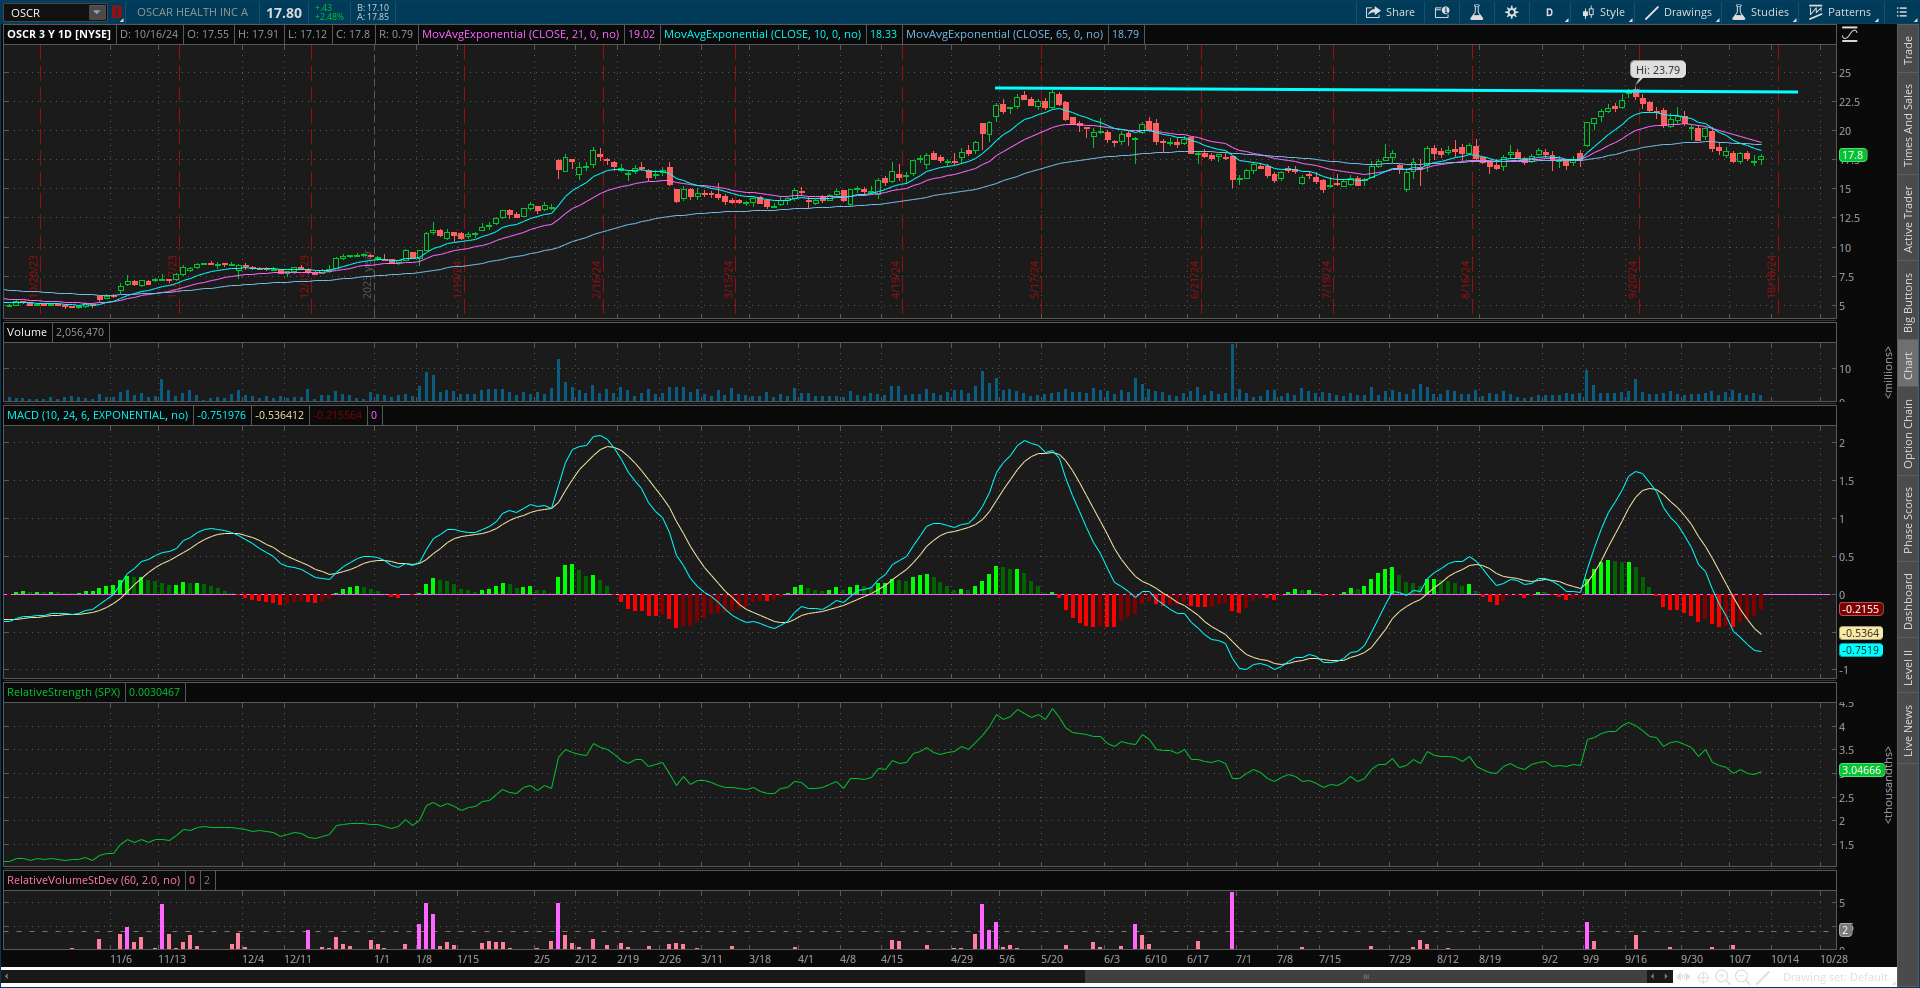
OSCR
IPO from 2021 that’s recently testing resistance around the $23 level. Making a smaller pullback off that level, but price moving lower than ideal. Will keep on watch as long as support at $17 holds. Watching for a move over $24.
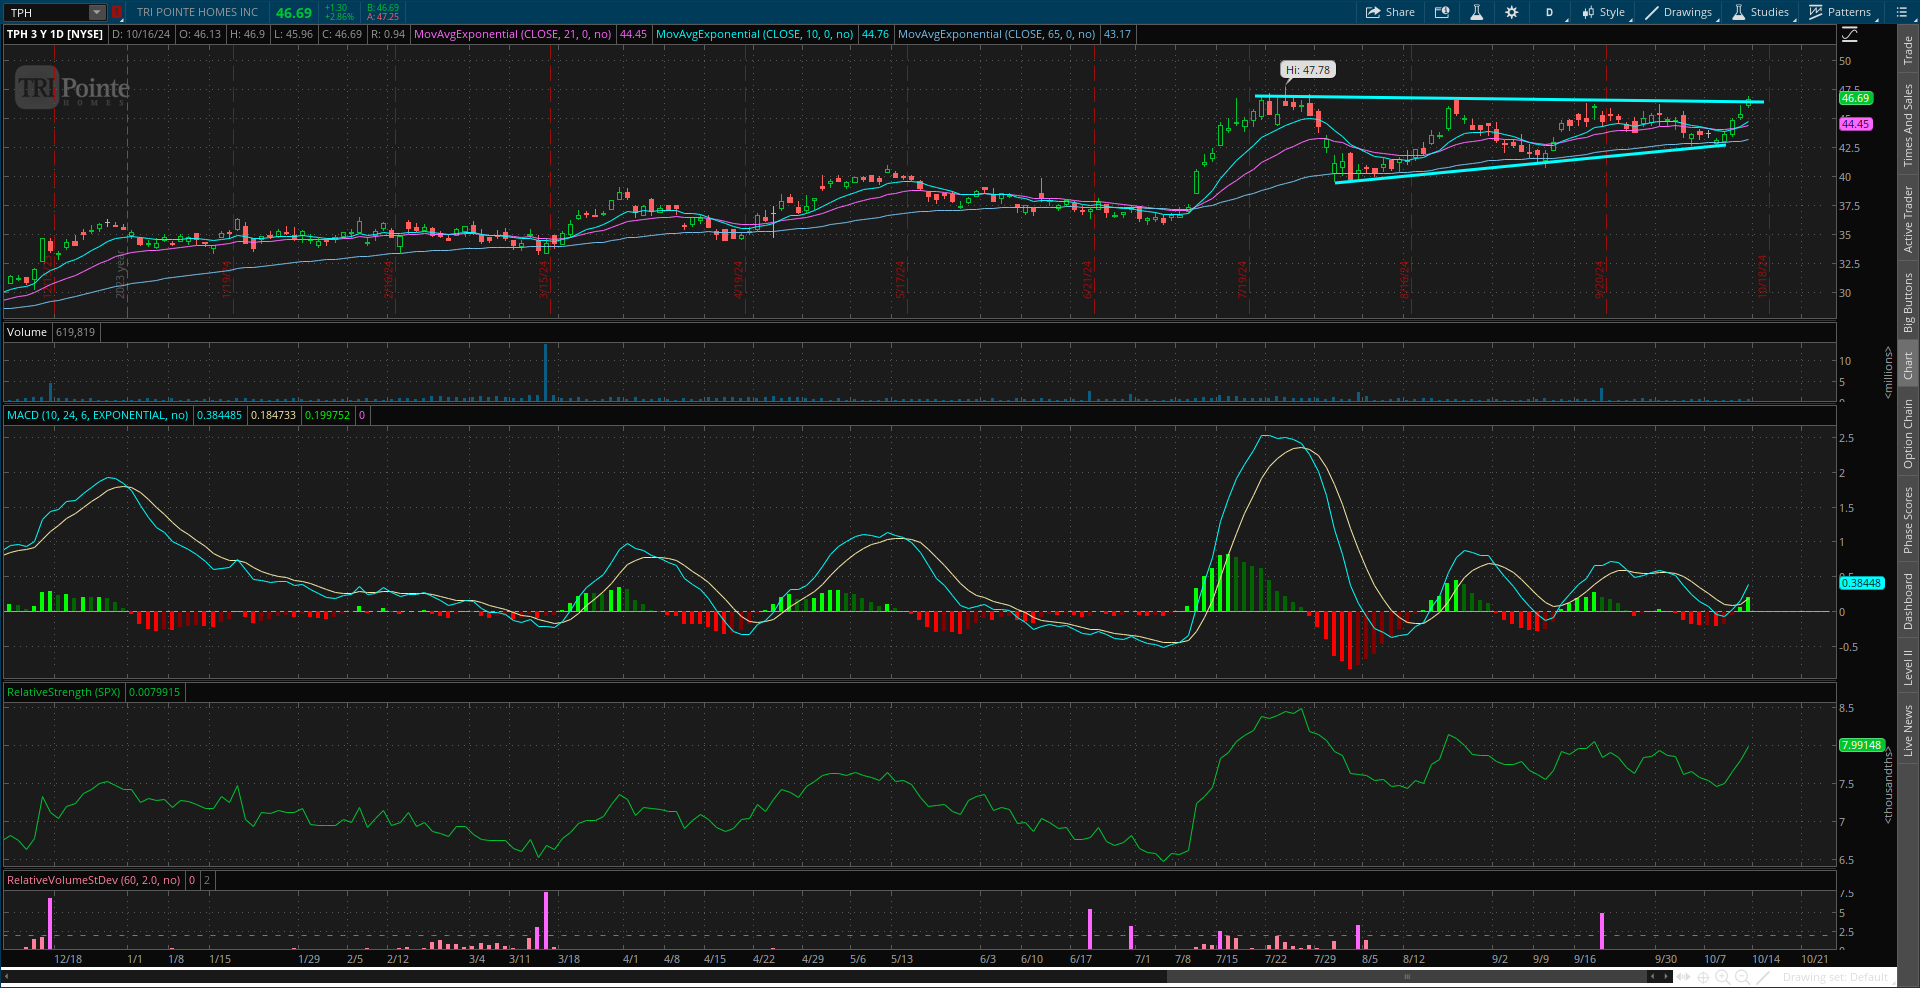
TPH
After rallying to the $47 level in July, the stock has been consolidating gains. Recent series of smaller pullbacks off the $47 resistance level, while the RS line is holding near the high. I’m watching for a breakout over $47 on higher volume with confirmation by the RS line.
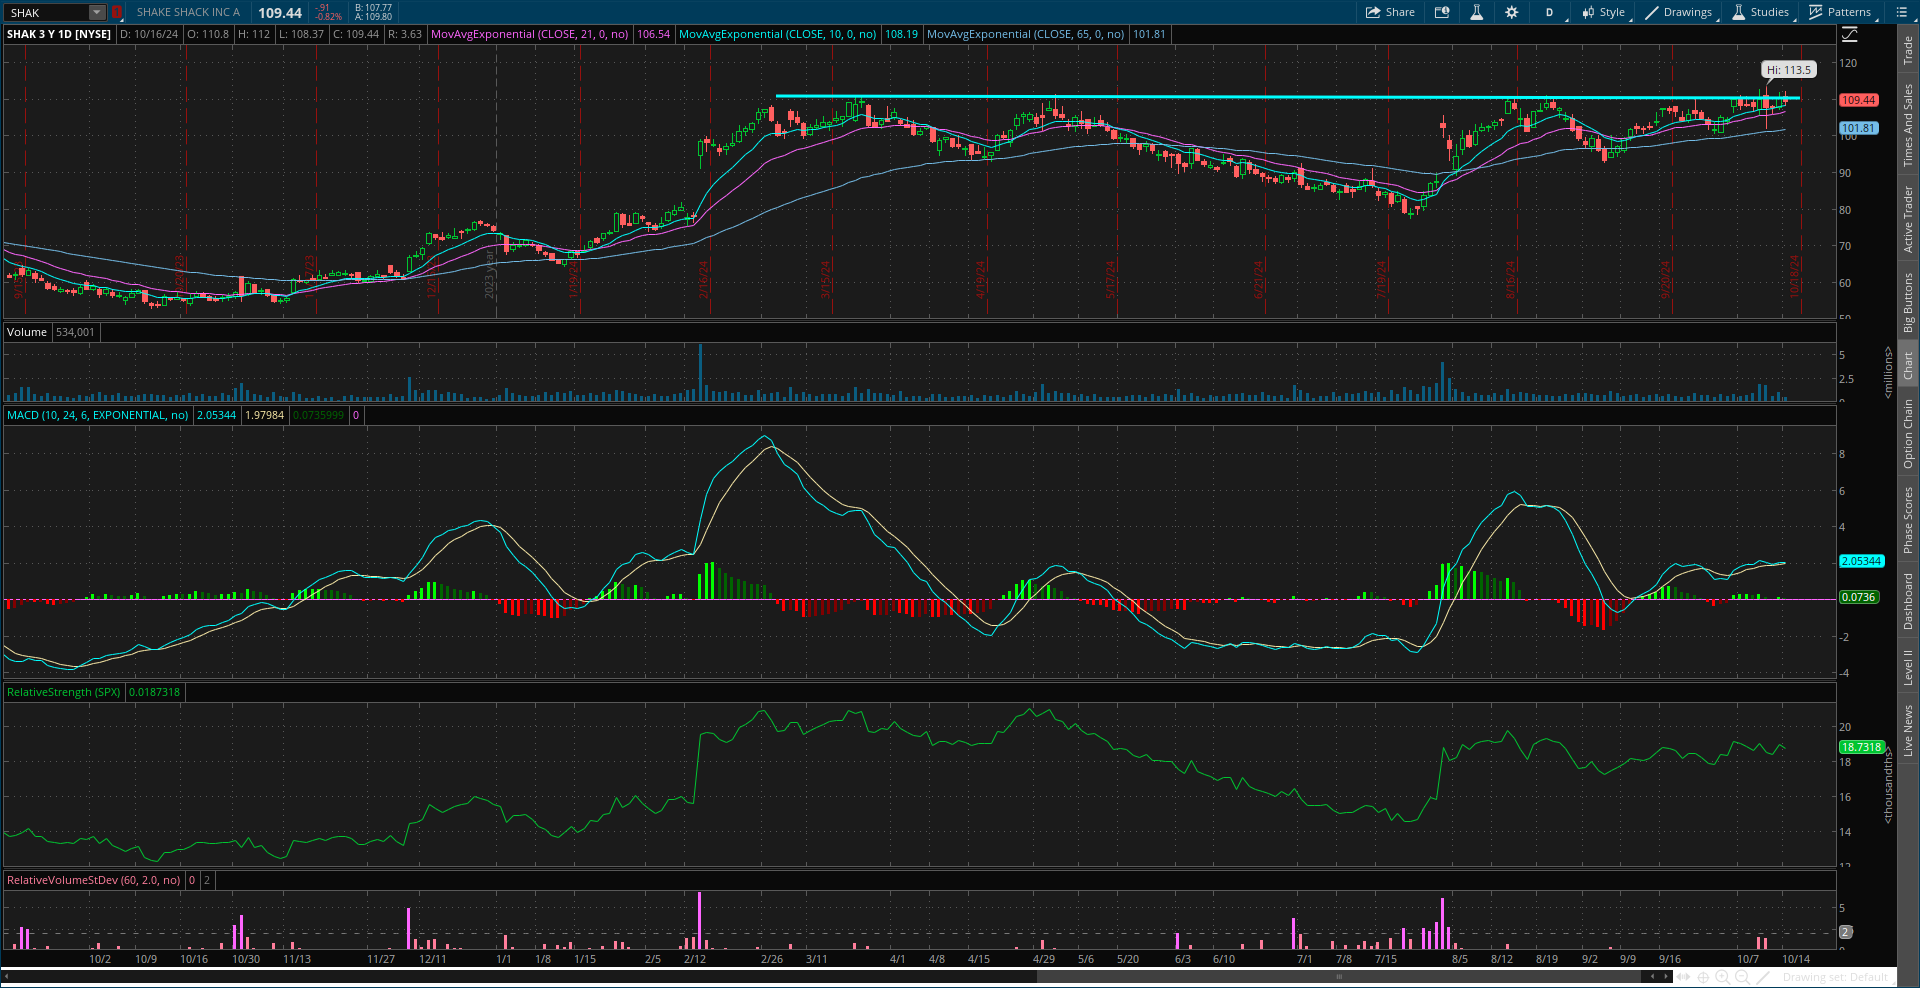
SHAK
Peaked at the $110 level back March, and creating a new basing pattern since then. Starting to make a series of higher lows following the pullback into July, with a recent MACD reset at zero just below price resistance. Watching for a move over $110.
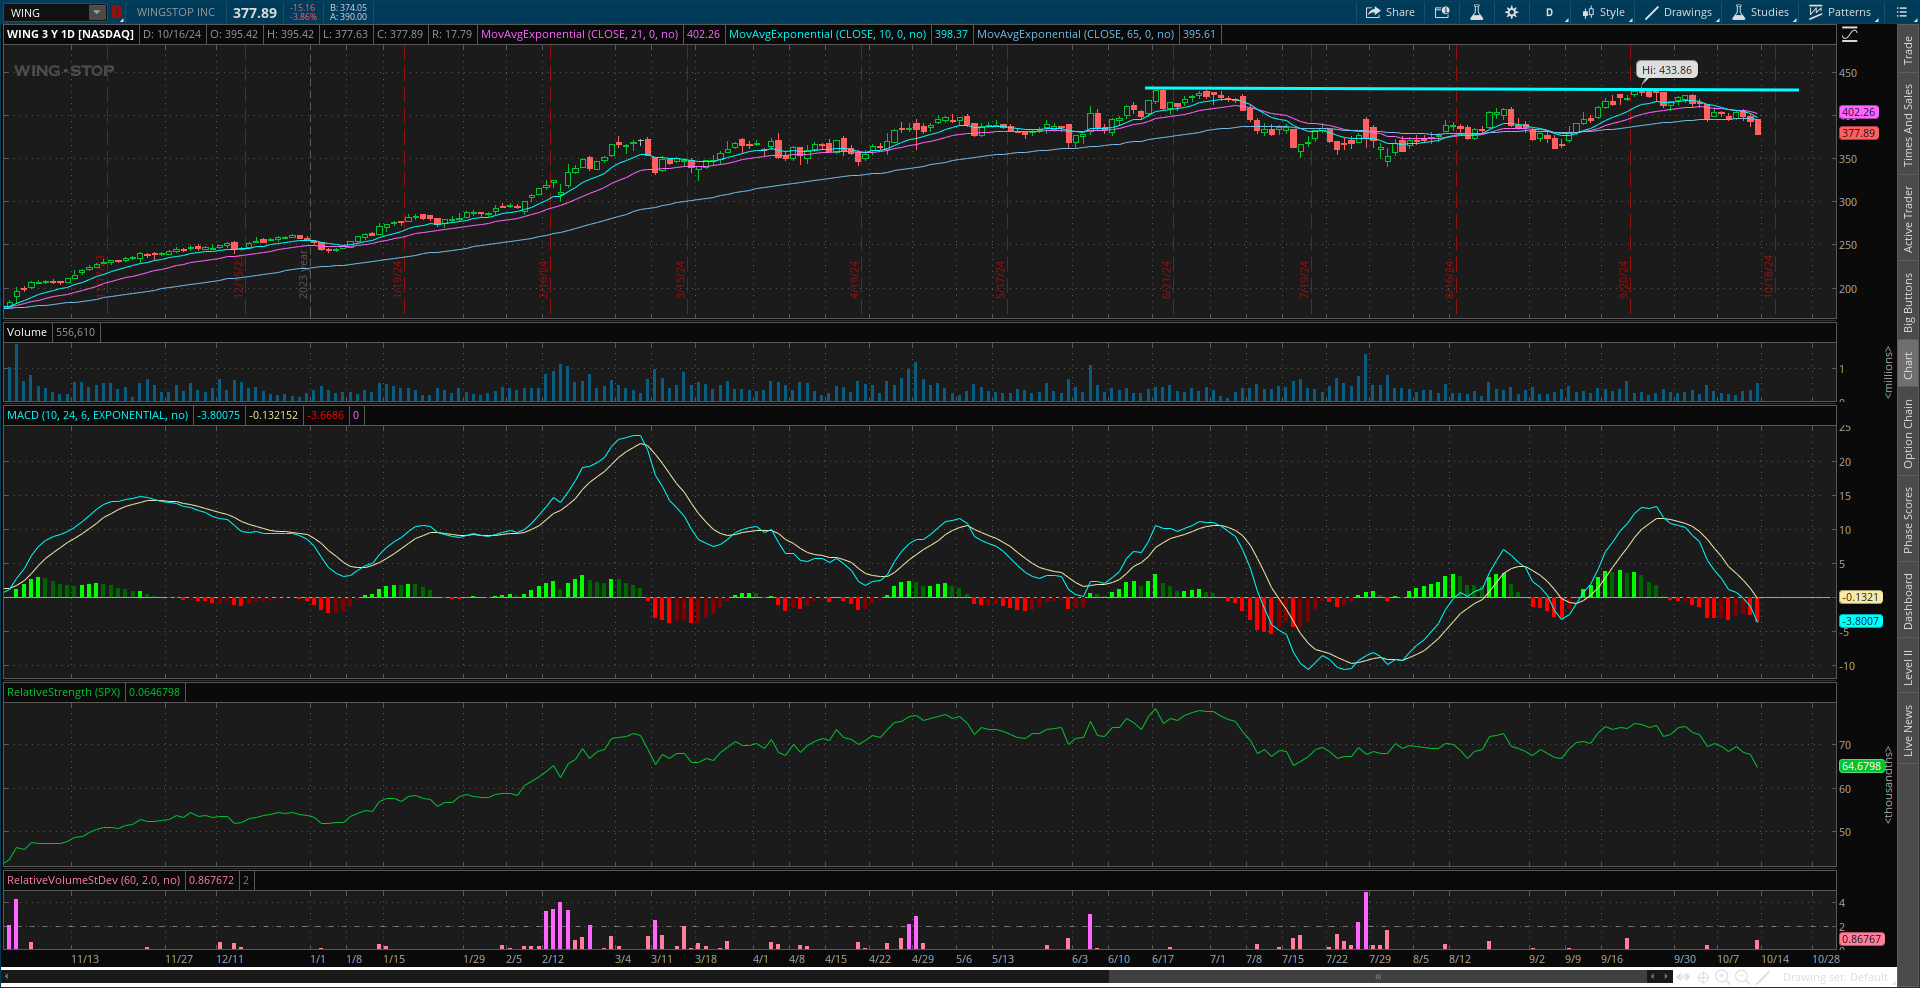
WING
Peaked around $430 back in June, and recently retesting that level again. Wanting to see one more smaller pullback that creates a MACD hook before trying to breakout. But price should not drop below $360 in the pattern. Looking for confirmation by the RS line on a move over $430.
CCS
Keeping on watch but following a new pattern. After moving over the $90 level, the stock back tested that area as support while creating a new basing pattern. Making a series of higher lows with resistance at $108. Watching for a breakout over that level.

FG
Broke out of a base back in November and rallied to the $48 area. Consolidating gains since the start of the year and recently rallying back toward $48. Want to see price hold support at the $35 level on any pullback.

Short Trade Setups
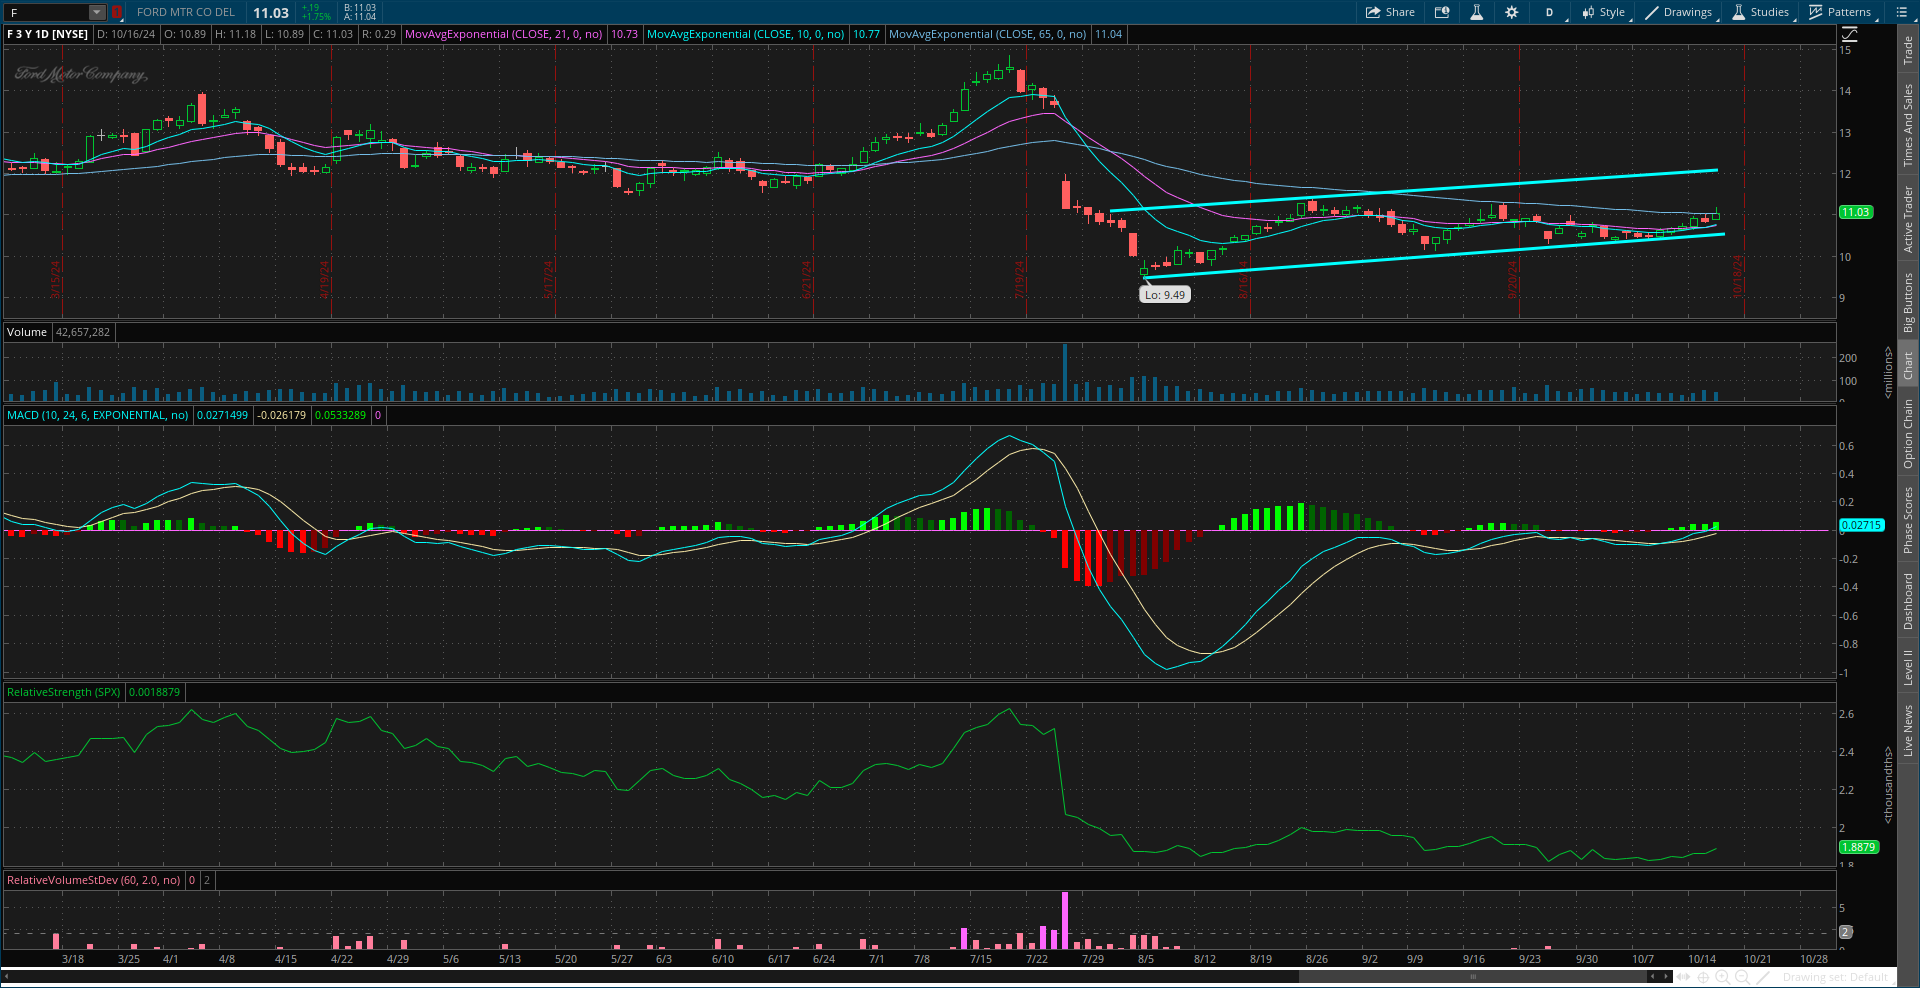
F
Rallying off a test of support at the $10 level. That reset the MACD below the zero line, while the RS line has stayed near the lows. Price now making a bearish flag pattern, with support at the $10.50 area. Watching for a break below the flag with confirmation by the RS line at new lows.
Rules of the Game
I trade chart breakouts based on the daily chart for long positions. And for price triggers on long setups, I tend to wait until the last half hour of trading to add a position. I find that emotional money trades the open, and smart money trades the close. If it looks like a stock is breaking out, I don’t want a “head fake” in the morning followed by a pullback later in the day.
I also use the RS line as a breakout filter. I find this improves the quality of the price signal and helps prevent false breakouts. So if price is moving out of a chart pattern, I want to see the RS line (the green line in the bottom panel of my charts) at new 52-week highs. Conversely, I prefer an RS line making new 52-week lows for short setups.
Also for long positions, I use the 21-day exponential moving average (EMA) as a stop. If in the last half hour of trading it looks like a position will close under the 21-day EMA, I’m usually selling whether it’s to take a loss or book a profit.
For short (or put) positions, I trade off a four-hour chart instead of a daily. Why? There’s a saying that stocks go up on an escalator and down on an elevator. Once a profitable trade starts to become oversold on the four-hour MACD, I start to take gains. Nothing like a short-covering rally to see your gains evaporate quickly, so I’m more proactive taking profits on short positions. I also use a 21-period EMA on the four-hour chart as a stop. If there is a close above the 21-period EMA, I tend to cover my short.
For updated charts, market analysis, and other trade ideas, give me a follow on X: @mosaicassetco
Disclaimer: these are not recommendations and just my thoughts and opinions…do your own due diligence! I may hold a position in the securities mentioned in this post.