

In this post, I’ll focus on setups that I’m monitoring for both long and short positions. With a chart and short write-up, this is a quick way to scan and plan potential trades.
These ideas are the end result of my process to identify stocks offering the right combination of growth fundamentals along with a proper chart setup. Live alerts are sent to Traders Hub members only.
***There will be no reports sent over the coming week while on vacation with my family✌️
Stock Market Update
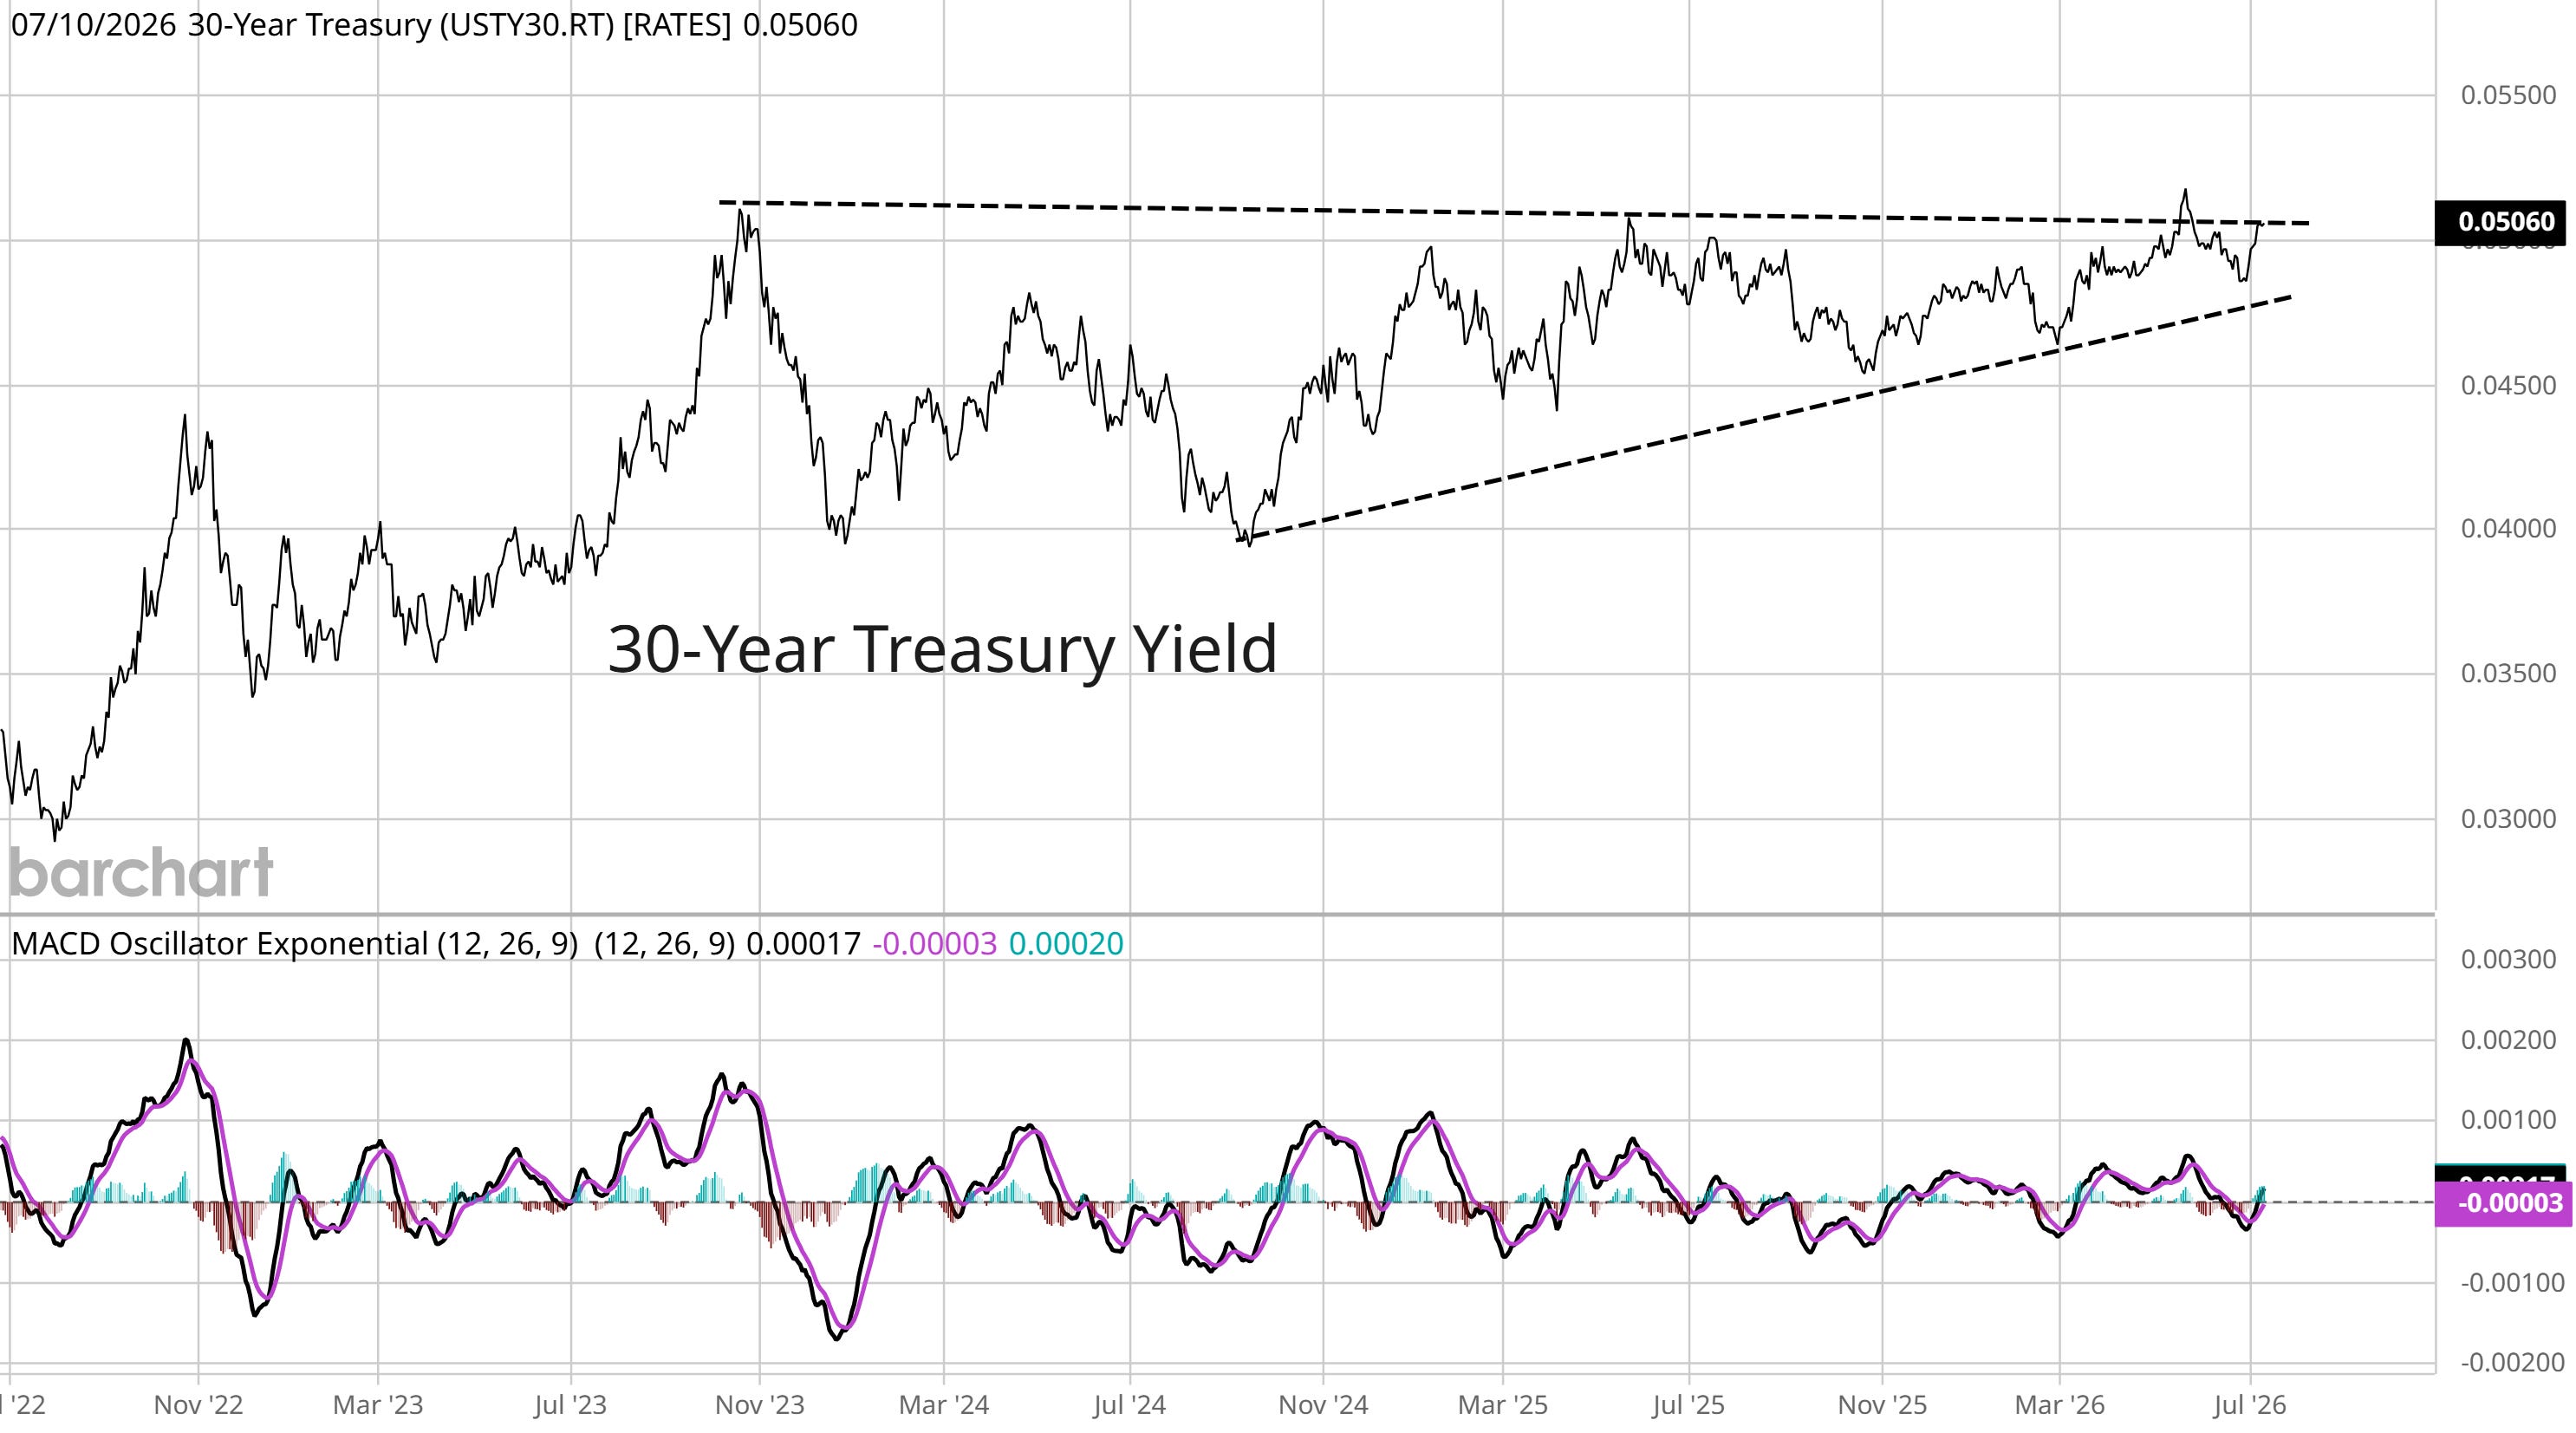
A tug-of-war is playing out in interest rates as inflation fears jump once again while recent labor market data came in softer than expected. Oil prices are jumping as military strikes between the U.S. and Iran intensify with President Trump declaring the ceasefire is over. Tanker traffic through the Strait of Hormuz was starting to normalize, but could be blocked once again. As we’ve seen since the start of the conflict, escalations and reversals happen often. But the threat of another jump in energy prices is placing upward pressure on long-term interest rates. On the other side, the June payrolls report came in much weaker than expected while prior months were revised lower. A sharp drop in the labor force participation rate was behind a decline in the unemployment rate. While there’s significant noise around rates, I’m keeping a close eye on the 30-year Treasury yield’s ascending triangle pattern below.
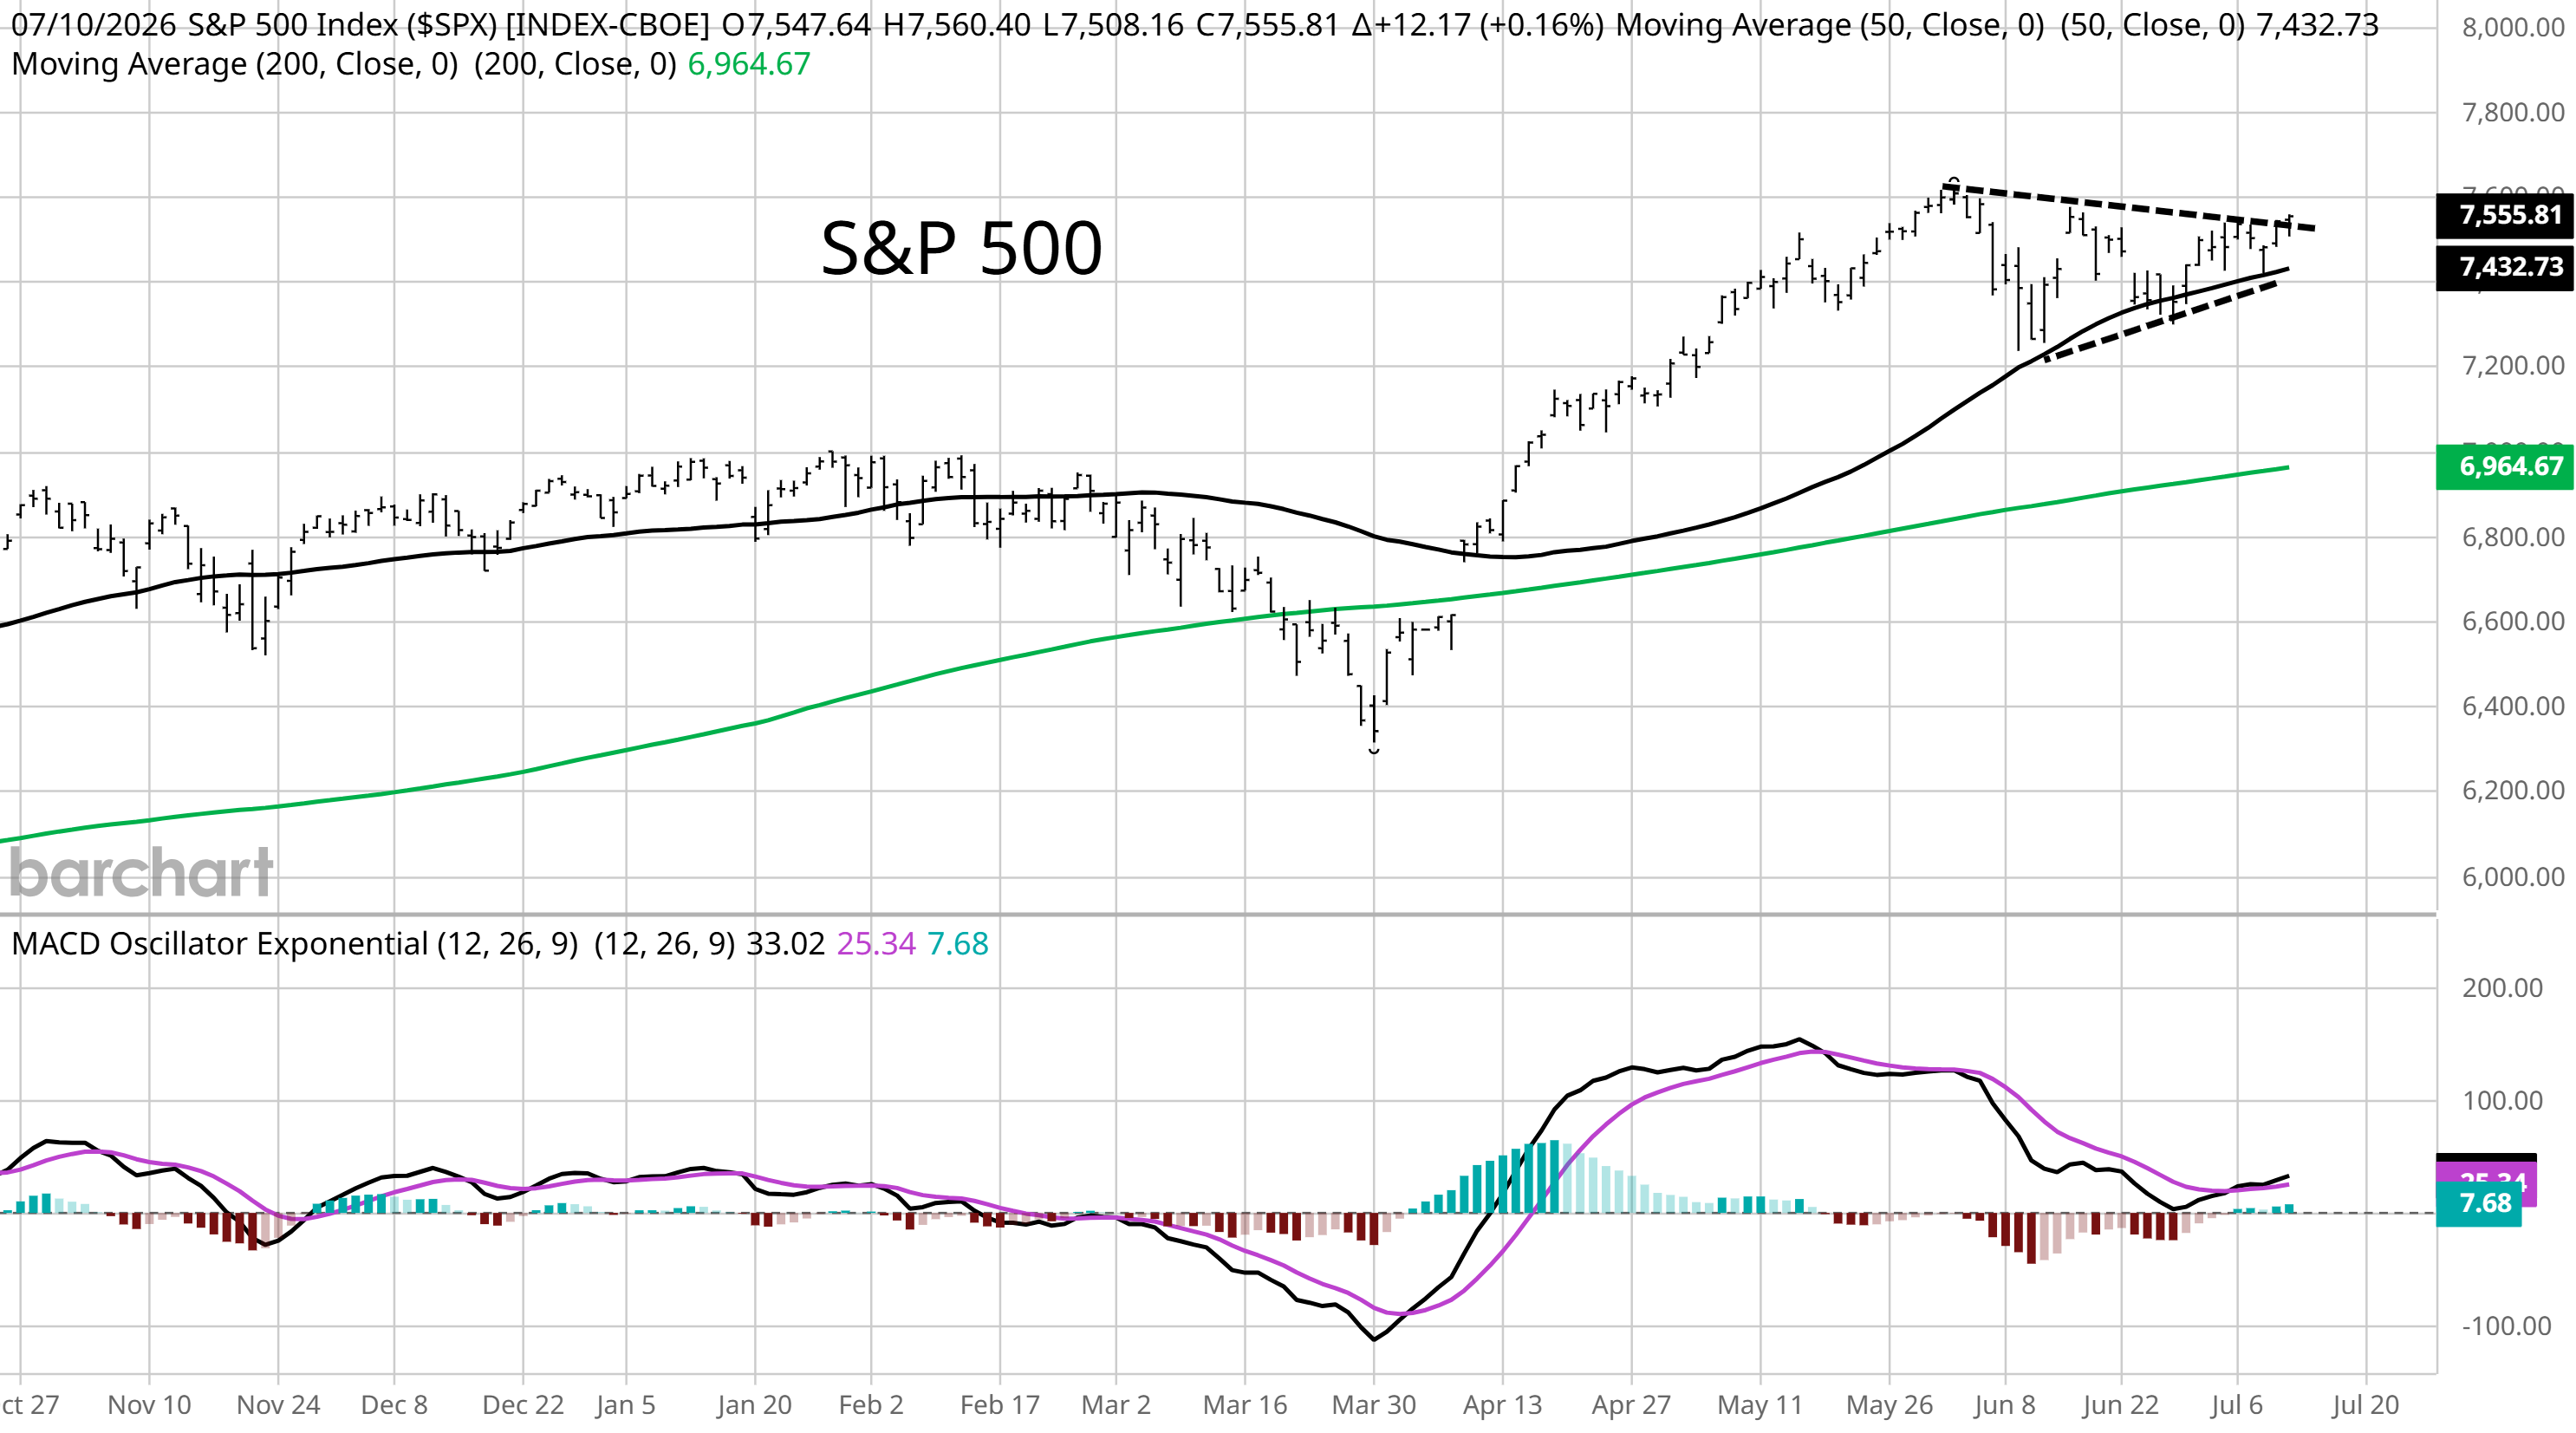
A breakout in long-term rates may present obstacles for the rally, but the S&P 500 is nearing completion of a short-term bullish chart pattern. The chart below shows the S&P is starting to breakout from a short-term symmetrical triangle pattern forming since the peak in June. Pullbacks in the pattern have found support at the 50-day moving average (black line), while the MACD is turning higher from a bullish reset at the zero line. The backdrop for a breakout remains bullish. Various measures of investor sentiment point to elevated levels of fear, calendar seasonality is favorable during July, and measures of market breadth are showing that the average stock is leading.
There has been a pullback in leading sectors and industries off the March lows, which could lead to the next round of bullish chart setups. That includes stocks leveraged to the AI infrastructure buildout like semiconductors, where many names are starting new basing patterns. Keep reading to see:
Open ETF positions.
Open stock positions.
Chart analysis for new trade ideas.
