In this post, I’ll focus on setups that I’m monitoring for both long and short positions. With a chart and short write-up, this is a quick way to scan and plan potential trades.
These ideas are the end result of my process to identify stocks offering the right combination of growth fundamentals along with a proper chart setup.
Stock Market Update
Investors are being forced to contend with conflicting economic data, and how much the economy is really deteriorating. While consumer and business sentiment takes a sharp turn lower, the hard data continues painting a mixed picture. The latest example comes from this week’s first quarter GDP report. The headline figure showed an annualized decline of 0.3% during 1Q, which was worst than expected and the first time GDP growth has contracted since early 2022. But decline was driven by a 41% surge in imports, which counts against the GDP figure as businesses stocked up ahead of anticipated tariffs.
GDP estimates from the Federal Reserve’s Atlanta district hinted at such a scenario unfolding. But other measures of the underlying economy contained in the report aren’t too alarming just yet. Consumer spending rose at a 1.8% pace, which is slower than prior quarters but better than economist estimates. Another measure looks at real final sales to private domestic purchasers which excludes the impact of net exports and government spending. It grew at a 3% annualized rate, which is in line with recent quarters as you can see below.

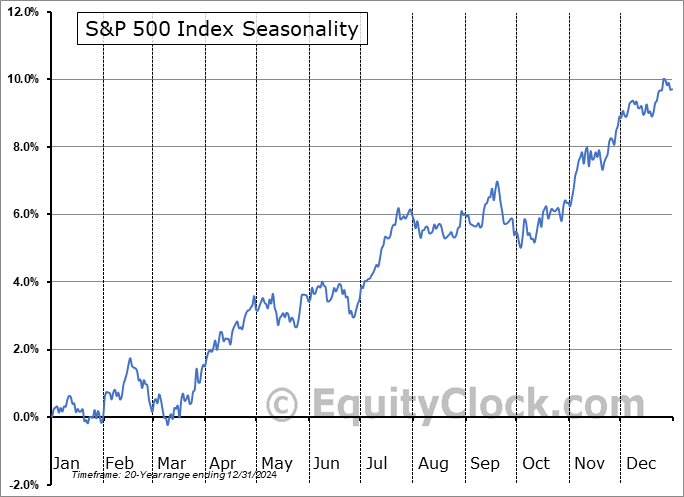
The longer-term outlook for the stock market will come down to the strength of the economy and earnings picture. More recently, stocks are enjoying a rally from oversold conditions and is being amplified by bearish investor positioning. That’s triggered a number of price and breadth thrusts across the stock market, which has positive implications for longer-term forward returns. Near-term, historic calendar seasonality starts to become a headwind soon. As April saw a massive reversal from the early month selloff, it’s worth remembering that April has seen strong S&P 500 seasonality based on 20-year data (chart below). If seasonal trends hold up, we could see price weakness during mid-May as the “sell in May and go away” six month stretch begins.
More bullish chart setups are emerging on my scans, and could benefit from one smaller pullback if we do see weak seasonals ahead. Those setups include a couple of last year’s leaders, which are setting up new bases that I’ll review below. Keep reading to see:
Open ETF positions.
Open stock positions.
Chart analysis for new trade ideas.


