

In this post, I’ll focus on setups that I’m monitoring for both long and short positions. With a chart and short write-up, this is a quick way to scan and plan potential trades.
These ideas are the end result of my process to identify stocks offering the right combination of growth fundamentals along with a proper chart setup.
You can sign up for a 7-day free trial here to unlock the model portfolio and trade ideas in this report.
Stock Market Update
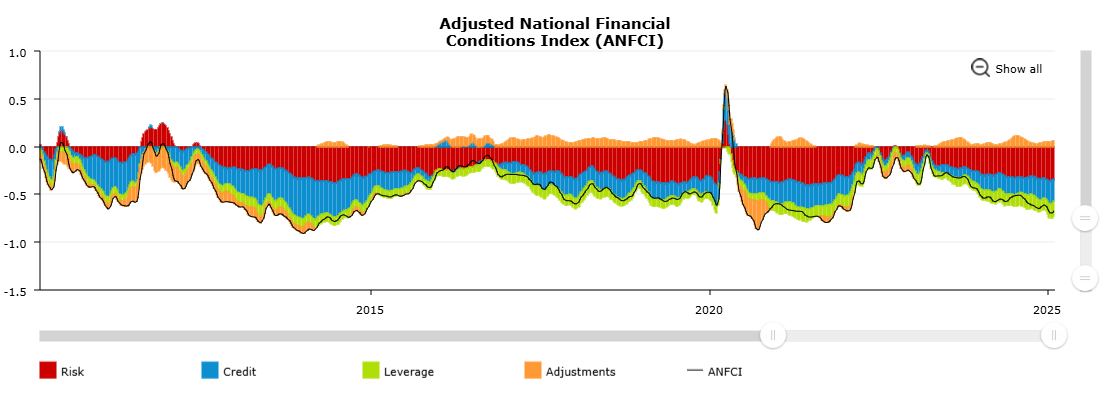
Minutes from the Federal Reserve’s last rate-setting meeting is the main economic event during this holiday-shortened week for the stock market. Not surprisingly, the minutes reinforced the notion that rate cuts are on hold until inflation begins moderating further. Those same minutes also expressed concerns about the potential impact of tariffs on the inflation outlook. But even before tariffs came into view, we’ve been tracking leading indicators of inflation that were already pointing to reacceleration. At the same time, financial conditions are running near their loosest levels in three years as you can see below. Above zero indicates tighter than average conditions and below zero points to looser than average conditions.
While loose financial conditions could stoke the inflation picture further, that’s because loose conditions are stimulative for economic activity. As long as the economic and earnings outlook remain intact, the S&P 500’s bull market can continue even if the outlook for further rate cuts gets called into question. This bull market is also still young by historical standards. After bottoming in October 2022, the S&P 500 has maintained the bull trend for 28 months now. But that’s still only half the median bull market duration since 1949 as you can see in the chart below. If the bull market were finished this month, it would become the third shortest bull since the 1950s.

While I still believe the primary trend for the stock market remains higher, that doesn’t mean there won’t be bumps along the way. Just as the S&P is pushing to new record highs this week, there's a growing short-term negative breadth divergence. The percent of stocks trading above their 20-day moving average (MA) across the major exchanges most recently peaked on January 21, and now stands at just 50% in the chart below. That means only half the stocks across the market are in short-term uptrends. It’s also worth remembering that we’re within the worst two-week stretch of S&P 500 seasonality based on historical data going back to 1928.

Keep reading below to see:
Open ETF positions.
Open stock positions.
Chart analysis for 8 trade ideas.
