Welcome back to Mosaic Chart Alerts!
In this post, I’ll focus on setups that I’m monitoring for both long and short positions. With a chart and short write-up, this is a quick way to scan and plan potential trades.
These ideas are the end result of my process to identify stocks offering the right combination of fundamentals along with a proper chart setup.
Here are my notes from a focus list of setups I’m monitoring.
Stock Market Update
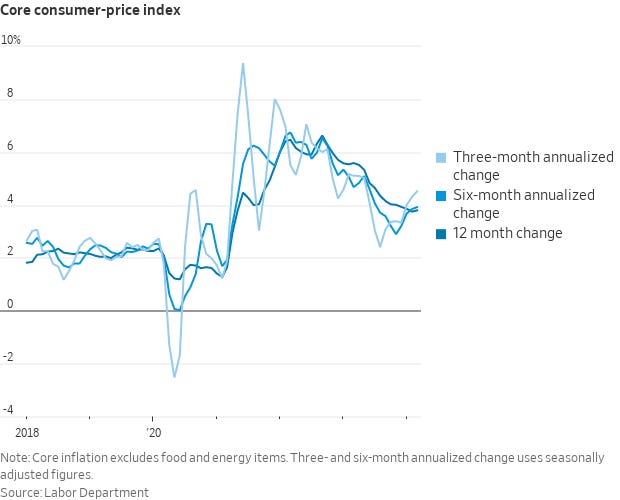
Following last week’s blowout jobs report for March, investor attention now turns to the Federal Reserve’s other mandate with price stability. And the stock market received the news it didn’t want, which is the Consumer Price Index (CPI) for March coming in hotter than expected all around. The headline figure increased by 3.5% compared to last year, while the core measure that strips out food and energy prices gained 3.8%. That was slightly higher than expectations for an increase of 3.4% and 3.7%, respectively. In addition, the core measure is now accelerating on a 3-, 6-, and 12-month annualized basis as you can see in the chart below. With the CPI report out of the way, the Producer Price Index (PPI) comes next and can lead changes in the CPI. That could provide further clues about the coming path of inflation.

In Sunday’s Market Mosaic, I made the case that recent breakouts and performance in commodities and related stock market sectors like energy and mining were sending an important signal about the inflation outlook. Those areas of the market perform well during environments marked by high and rising inflation. If the rate of change in price indicators do sustain a period of acceleration, that will put pressure on the Fed to postpone rate cuts. Along with an economy that seems to be firing on all cylinders, market-implied odds for interest rate cuts this year are shifting again. You can see in the table below that odds now favor just one or two 0.25% cuts through year-end. That’s remarkable because odds were pricing as many as seven cuts at the start of the year.
But if there’s something else to note, it’s that stocks have kept rallying throughout 2024 with the S&P 500 up 8% year-to-date even including today’s pullback. That’s happening against the backdrop of falling expectations for rate cuts, which should be a negative for stock prices. In my opinion, that shows the corporate earnings picture is more important for the market, and I’ve discussed frequently that stocks follow earnings over the long-term. While there will be near-term volatility and noise in the stock market as always, I believe the bull market will stay intact until evidence suggests that tighter monetary policy is catching up to the economy. For this week, I’m removing HUBS from the watchlist as the stock breaks out to complete its pattern. I’m also removing INSW. The stock attempted to move above resistance and then fell back into the pattern, which also wasn’t confirmed by the relative strength (RS) line to a new 52-week high. I have no interest in weak follow through, and would rather add new names to the watchlist.
Keep reading below for all the updates…
Long Trade Setups
ITRI
Gapped over $80 from a basing pattern going back to July. Trading in a tight range that’s held support above the breakaway gap, with a new resistance level around $100. Looking for a move over $100 with the RS line at a new 52-week high.
URA
Putting uranium miners back on the watchlist. The ETF recently testing resistance again at the $32 level, which is a key level going back to 2021. Would now like to see a MACD reset at the zero line followed by a breakout.
TRMD
Broke out over a prior resistance level at $32 and now back testing that level as support. The RS line is near the high while the MACD is trying to turn up from zero. Watching for a move over $37.
NET
Making a series of higher lows since last May as part of an overall bottoming base. Price recently filling a big gap from February, and holding that support level while the MACD resets at the zero line. Looking for a move over $105 followed by $110.
DUOL
Recently testing the prior highs around $245. Would like to seeing more basing action following the February gap higher along with an improvement in the RS line. Watching for a breakout over $245.
CUBI
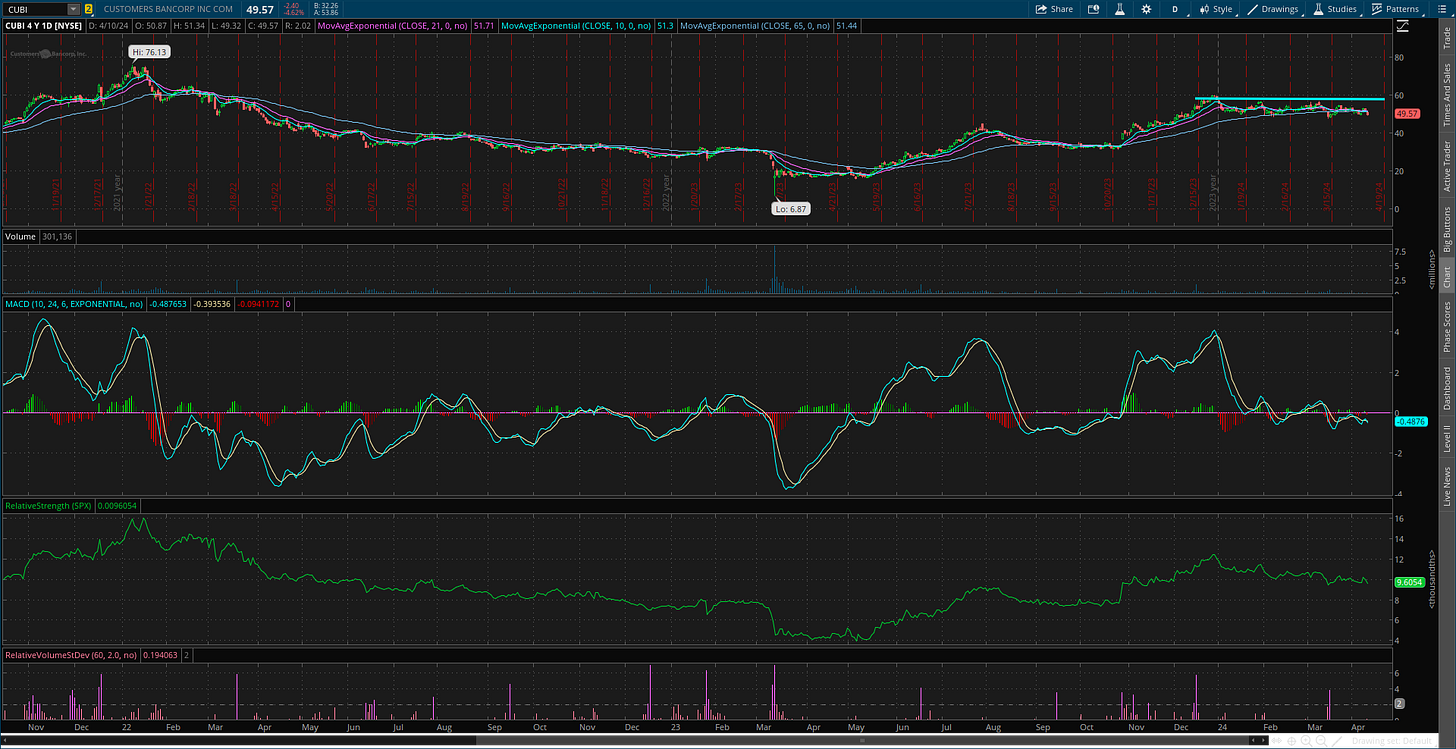
Consolidating the gains after hitting $60 in late December. Would prefer to see the RS line take out the December peak on any breakout attempt. A move over $60 could target the prior high from the start of 2022.
STNE
Starting to emerge from a bottoming base going back two years. Took out resistance at $15 and now consolidating the gains. Trading sideways since late December, with a new resistance level near $19. Want to see support at $16 hold in the pattern.
BX
Since peaking back in 2021, the chart has the appearance of a large saucer-type pattern. Price recently nearing the prior high at $140 and now pulling back. That’s resetting the MACD while price holds support at $115. Watching for a move to new highs over $140.
Short Trade Setups
None this week!
Rules of the Game
I trade chart breakouts based on the daily chart for long positions. And for price triggers on long setups, I tend to wait until the last half hour of trading to add a position. I find that emotional money trades the open, and smart money trades the close. If it looks like a stock is breaking out, I don’t want a “head fake” in the morning followed by a pullback later in the day.
I also use the RS line as a breakout filter. I find this improves the quality of the price signal and helps prevent false breakouts. So if price is moving out of a chart pattern, I want to see the RS line (the green line in the bottom panel of my charts) at new 52-week highs. Conversely, I prefer an RS line making new 52-week lows for short setups.
Also for long positions, I use the 21-day exponential moving average (EMA) as a stop. If in the last half hour of trading it looks like a position will close under the 21-day EMA, I’m usually selling whether it’s to take a loss or book a profit.
For short (or put) positions, I trade off a four-hour chart instead of a daily. Why? There’s a saying that stocks go up on an escalator and down on an elevator. Once a profitable trade starts to become oversold on the four-hour MACD, I start to take gains. Nothing like a short-covering rally to see your gains evaporate quickly, so I’m more proactive taking profits on short positions. I also use a 21-period EMA on the four-hour chart as a stop. If there is a close above the 21-period EMA, I tend to cover my short.
For updated charts, market analysis, and other trade ideas, give me a follow on X: @mosaicassetco
Disclaimer: these are not recommendations and just my thoughts and opinions…do your own due diligence! I may hold a position in the securities mentioned in this post.


I use a similar trading strategy using MACD and RSI. I also added the indicator called “Know Sure Thing” (KST) and it is a confirming indicator used with MACD. Recent trades that did well in today’s market despite the large drop across indices include: DVN,F, HAS, REPX, and STAA. Also consider using Bollinger Bands, particularly monitoring the upper channel for price action, the median line for change in direction, and the lower channel for exit strategies.