In this post, I’ll focus on setups that I’m monitoring for both long and short positions. With a chart and short write-up, this is a quick way to scan and plan potential trades.
These ideas are the end result of my process to identify stocks offering the right combination of growth fundamentals along with a proper chart setup.
Stock Market Update
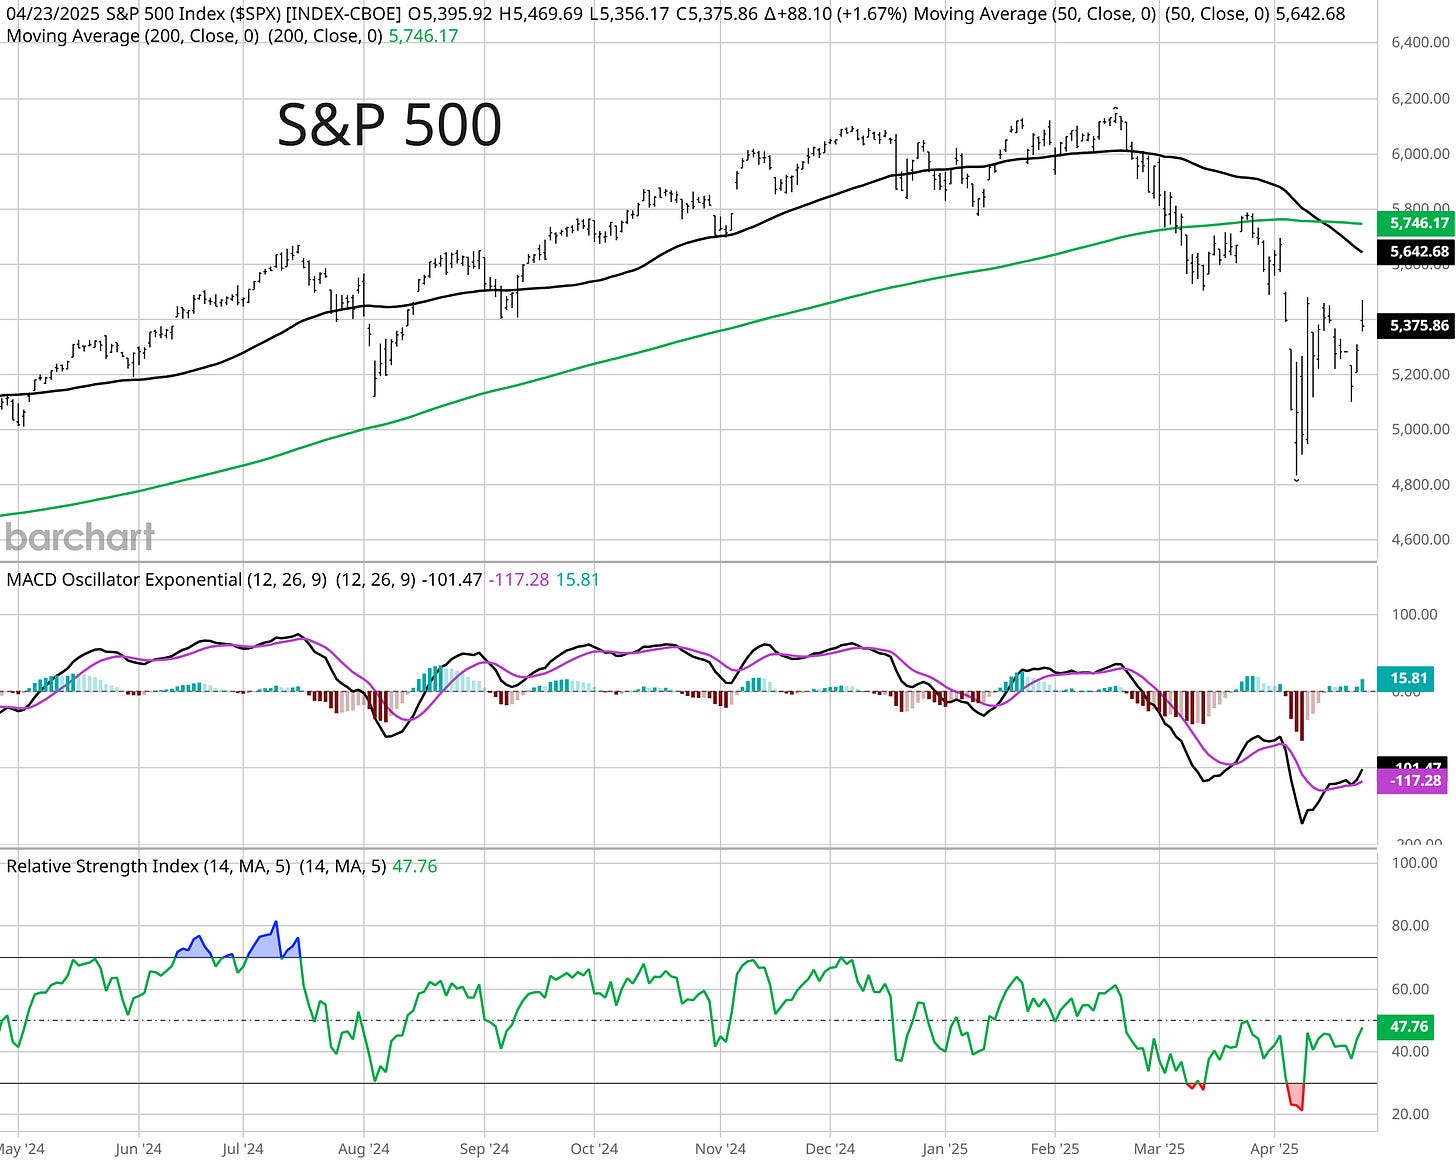
An apparent easing of tensions on multiple fronts is driving a rally across the stock market. Comments came first from Treasury Secretary Bessent, and how the trade war with China is not sustainable following the most recent tariff increase to 145%. And then President Trump weighed in, stating that China tariffs will come down substantially. Given the fast and unpredictable developments around the trade war since tariffs were first announced months ago, it’s hard to place too much lasting emphasis on the news. But even the slightest sign of easing tensions was enough to spark a relief rally from oversold levels (S&P 500 chart below with MACD and RSI). It also helped market sentiment when Trump walked back comments over removing Federal Reserve Chair Jerome Powell from his post.
While it’s hard to predict what the next headline will bring for investors, it’s much easier to stay objective and evaluate underlying market conditions and technicals that could tip the next move in the stock market. Over the past week, we’ve seen yet more evidence of extremely bearish investor positioning and sentiment data. At the same time, there’s been an improvement in the average stock. That followed the surge in the NYSE advance-decline ratio to 37/1 on April 9th. Since then, I’ve noted it would be important to see a cluster of strong A/D days or other signs of breadth thrusts to signal a durable rally. We’ve seen a cluster since then, including a subsequent NYSE A/D day that registered 12/1.
I believe the conditions remain in place to see a rally unfold over the near-term. But as I’ve shared with Hub members, my current base case scenario is to see a retest of the lows as opposed to a V-bottom in the stock market. The last two V-bottoms following a ~20% decline in the S&P 500 were supported by the Fed via a dovish pivot in stance (2018) or large monetary stimulus (2020). Based on recent comments, it’s doubtful the Fed emerges as a positive catalyst this time around.
Keep reading to see:
Open ETF positions.
Open stock positions.
Chart analysis for new trade ideas.


