Welcome back to Mosaic Chart Alerts!
In this post, I’ll focus on setups that I’m monitoring for both long and short positions. With a chart and short write-up, this is a quick way to scan and plan potential trades.
These ideas are the end result of my process to identify stocks offering the right combination of fundamentals along with a proper chart setup.
Here are my notes from a focus list of setups I’m monitoring.
Stock Market Update
Investor attention quickly pivoted this week to the Federal Reserve and the outlook for interest rates. That’s due to comments made by Fed Governor Christopher Waller, who voiced confidence that inflation will fall back to target in the months ahead. That could allow the Fed to start cutting rates as soon as this spring, which is reinforcing market-implied odds that are pricing rate cuts by May.
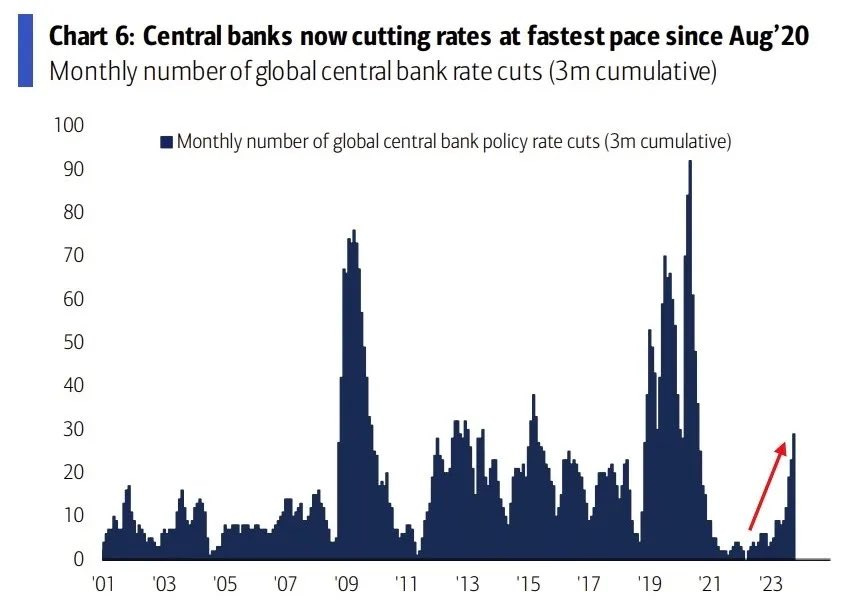
At the same time, there’s already a growing number of central banks around the world cutting rates, which is at the highest level in three years as you can see in the chart below (h/t Maverick Equity Research). And for the first time since 2021, there are more central banks cutting rates than hiking them. While that stat may not be as impressive when adjusting for the size of economies seeing rate cuts (after all, the Fed and ECB aren’t reducing rates yet), it shows a global trend that could catch-on in the U.S. especially given comments by Waller who tends to lean hawkish.
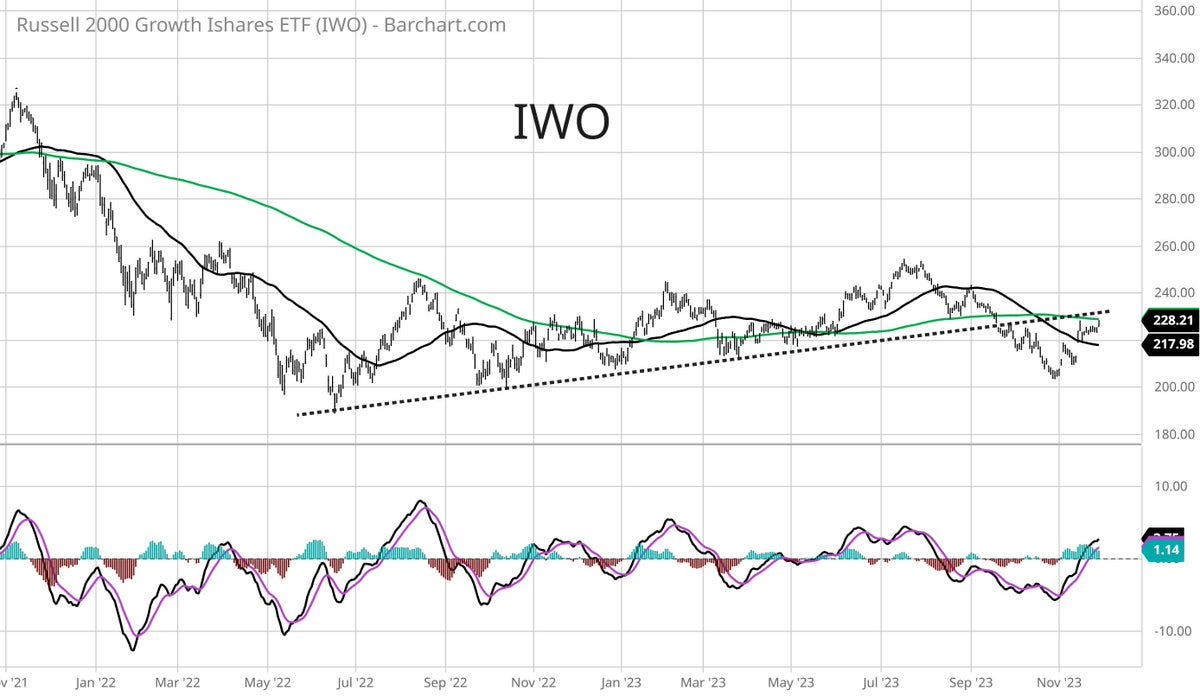
The prospect of falling interest rates is further fuel for stocks to rally. That’s because interest rates impact liquidity, and liquidity is the lifeblood of all asset prices. That’s especially the case for speculative assets, like growth stocks that are in the early stages of their life cycle. I’ve posted previously about tracking the speculative growth space, and the importance of “risk-on” investor sentiment marking easier trading environments. So I’m keeping a close eye on small-cap growth ETFs, like IWO that tracks the Russell 2000 Growth Index. After nearing 2022’s lows a month ago, IWO is attempting to rally and is now approaching a couple key levels. Price is coming up to resistance at the 200-day moving average (MA - green line). That area is also trendline resistance off 2022's lows. Ideally any pullback holds the gap from November 14th. A move above those resistance levels is a great sign for risk assets.
The trading environment is certainly becoming more constructive over the past few weeks. Positive breadth divergences at the end of October were followed by breadth thrusts, and now we’re seeing a more persistent trend of net new 52-week highs across the stock market. I still believe a pause in the uptrend is due, and would help many chart setups that I’m monitoring. But there’s no denying the character change in the stock market, with recent breakouts continuing to work well. For this week, I’m taking AGI off the watchlist as its pattern completes with the recent strength in gold prices. I’m also removing RNR as its relative strength (RS) line weakens in the basing pattern, especially since there are better opportunities to add to the watchlist.
Keep reading below for all the updates…
Long Trade Setups
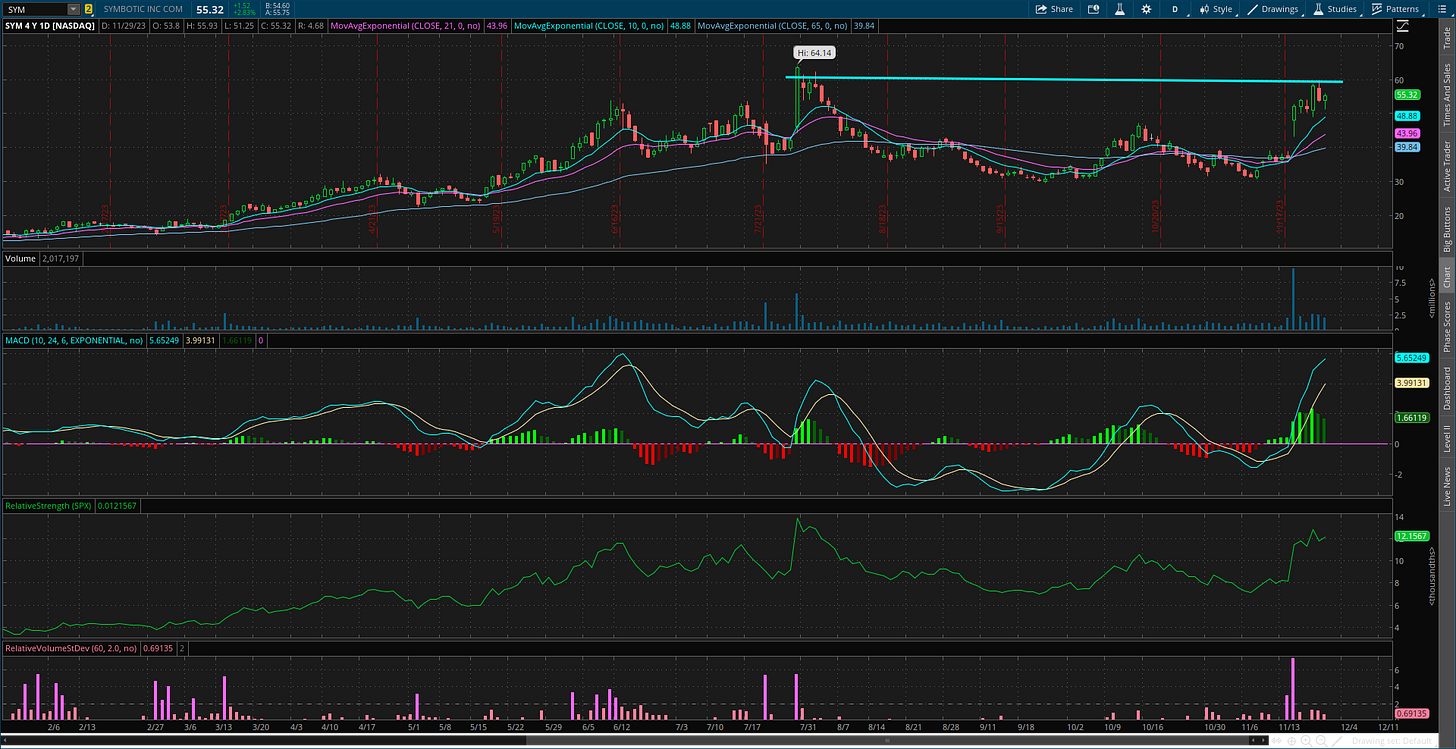
SYM
Big run over the past couple weeks (+100% sheesh...) to test resistance around $60. Need to see momentum reset for another move, so ideally the stock trades sideways for a period to reset the MACD at the zero line. If that happens, I would look to buy a breakout to new highs confirmed by rising volume and the RS line at new highs.
IOT
An IPO from 2021 trading just below the highs around $30. Trading sideways in a range since June, with price back near resistance. Ideal scenario is that the MACD resets with price basing just below the highs before breaking out.
MBLY
Making a quick move higher over the past month off support around $34. My ideal trade setup is price tests resistance around $45 then does a small retracement of the rally. Look for MACD to reset at zero in that scenario, followed by an attempt to breakout over $45.
SN
Another IPO basing in a tight range since September, creating a resistance level around the $46 area. Recently moving over that level with the MACD turning up from zero, but the RS line just shy of confirming. Will keep on watch to monitor price action.
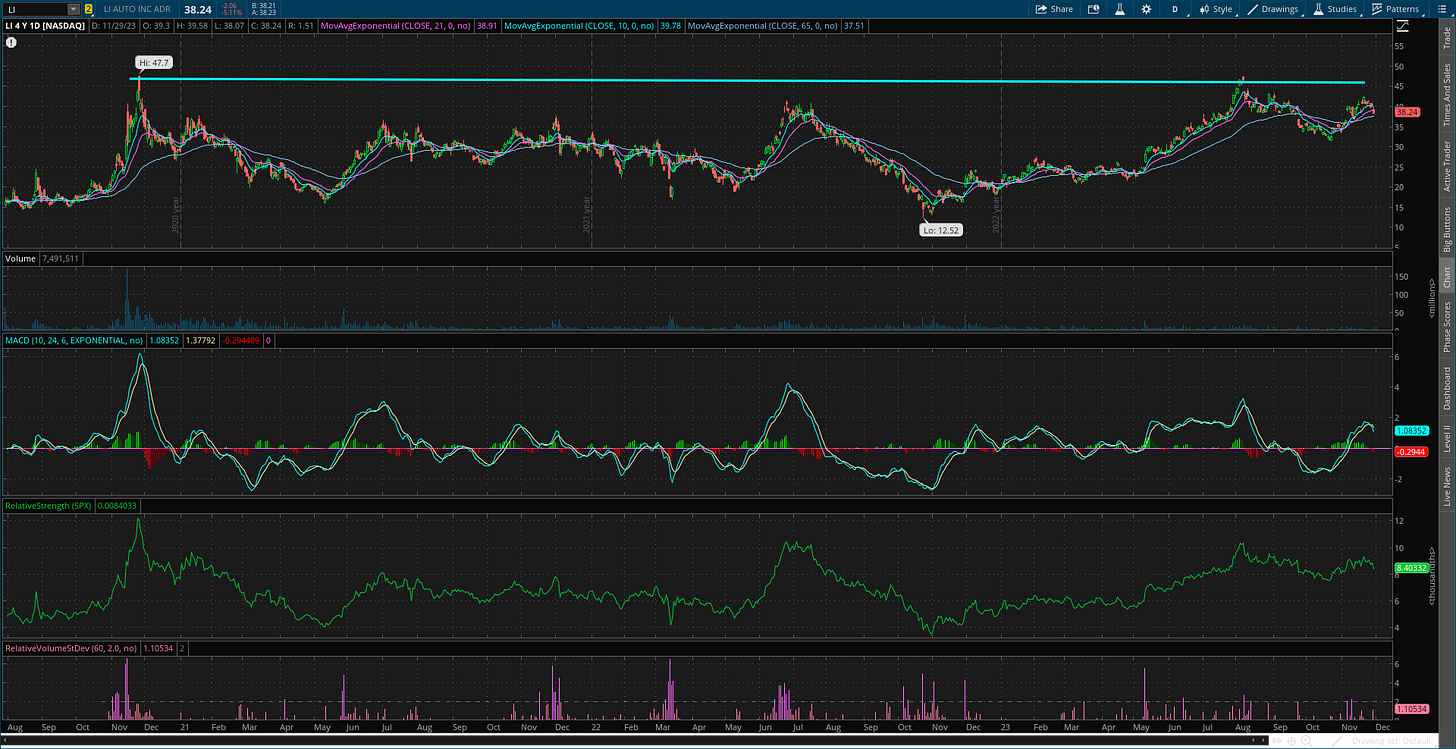
LI
Price starting to rally again after testing the post-IPO highs around $45. In an ideal setup, price trades sideways to reset the MACD at the zero line. That sets up a breakout over $45, which should see rising volume and confirmation with the RS line at new highs.
GES
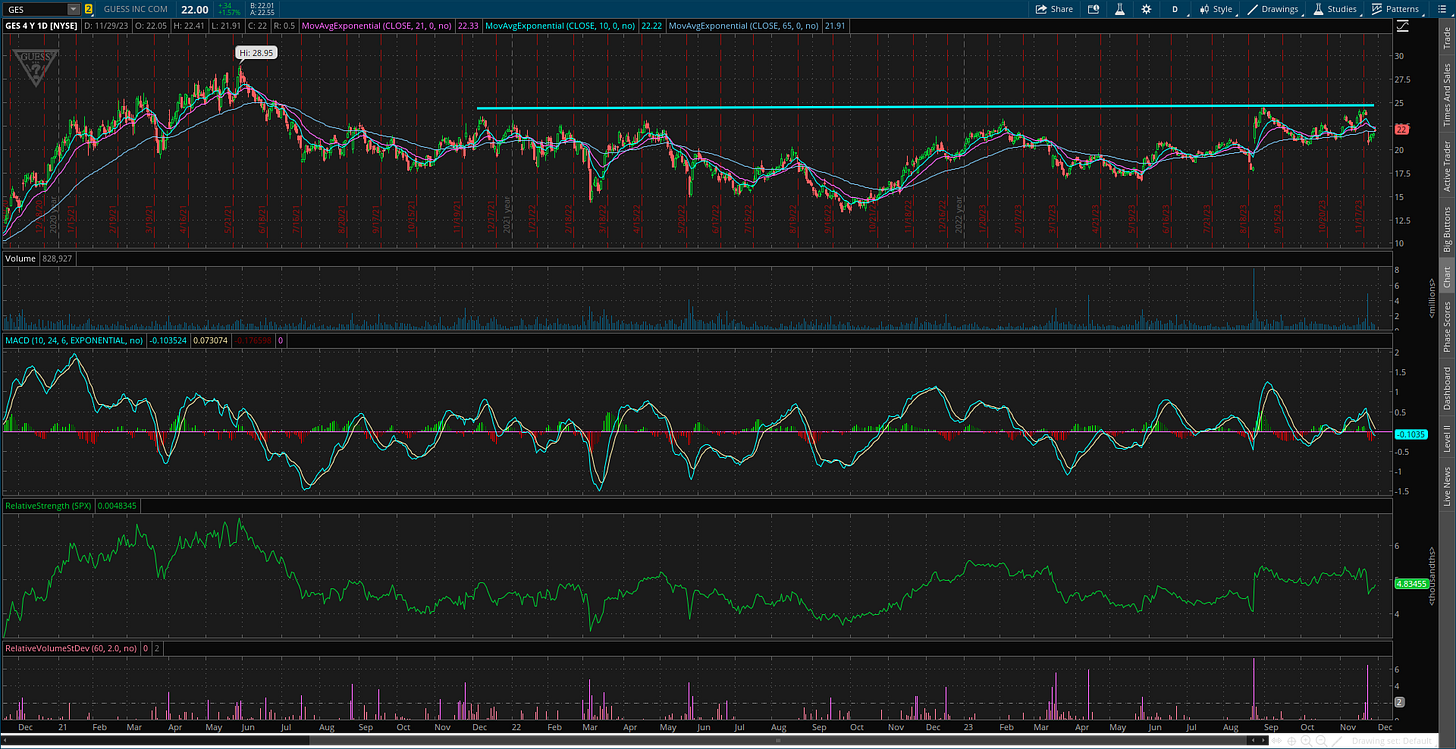
Pulled back after reporting earnings. Will keep on the watchlist for now as long as support at $20 holds. Still watching resistance at $25, which is a level tested several times going back to 2021. Series of higher lows since last October’s bottom. A breakout could target the prior high near $29.
AXON
Creating a resistance level just below $230 going back to March. Price also making a series of higher lows since July. Prefer to see the RS line make a 52-week high on a breakout attempt.
YELP
Trading in a bullish flag pattern following the rally from $27 in May. Looking for a move above trendline resistance around $47. The RS line is staying close to 52-week highs.
URNM
Uranium stocks could be basing for another move higher. The URNM uranium ETF is pulling back this week after testing resistance again at $50. May need to see another MACD reset before a breakout attempt.
NVGS
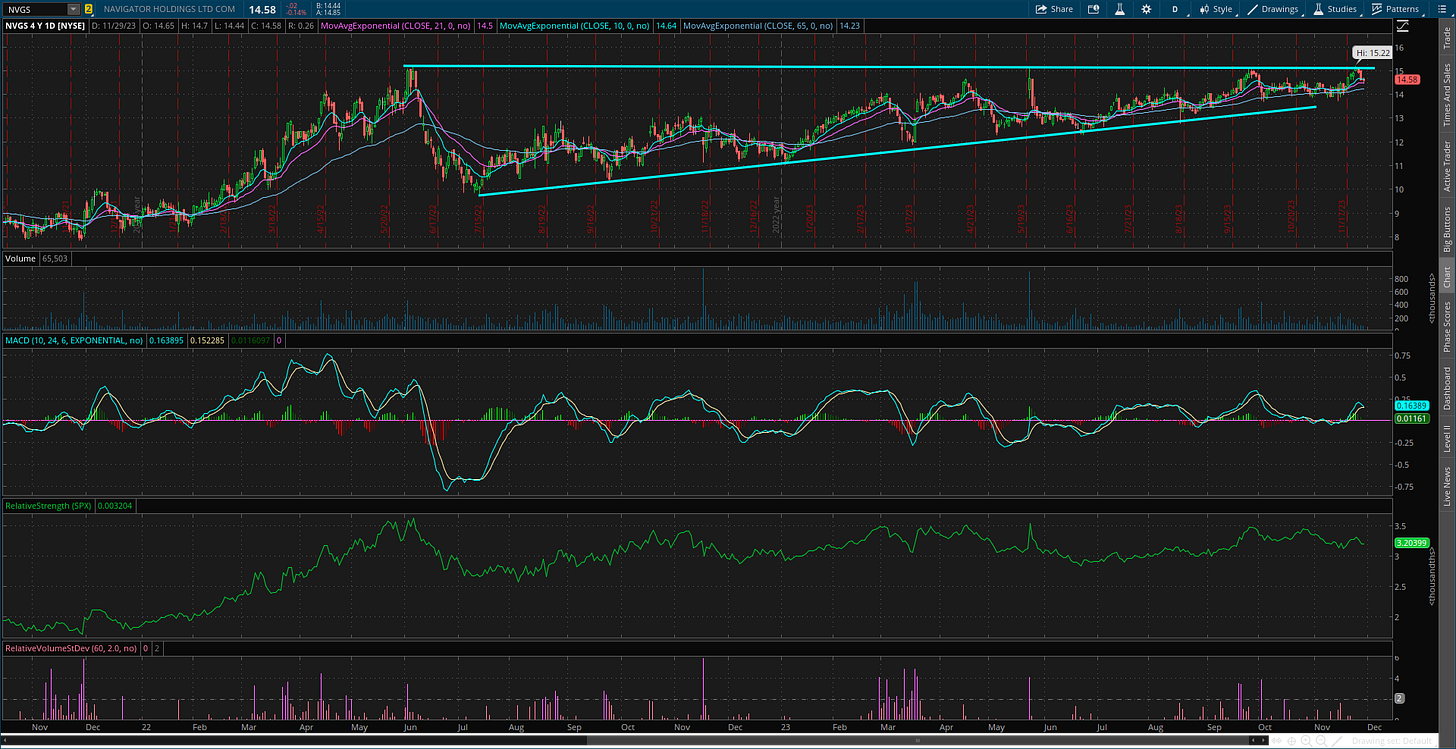
Price firming up in a base that extends back over a year. Making a run toward resistance around the $15 level. MACD in a good position to support a breakout, with trendline resistance being tested recently.
Short Trade Setups
None this week!
Rules of the Game
I trade chart breakouts based on the daily chart for long positions. And for price triggers on long setups, I tend to wait until the last half hour of trading to add a position. I find that emotional money trades the open, and smart money trades the close. If it looks like a stock is breaking out, I don’t want a “head fake” in the morning followed by a pullback later in the day.
I also use the RS line as a breakout filter. I find this improves the quality of the price signal and helps prevent false breakouts. So if price is moving out of a chart pattern, I want to see the RS line (the green line in the bottom panel of my charts) at new 52-week highs. Conversely, I prefer an RS line making new 52-week lows for short setups.
Also for long positions, I use the 21-day exponential moving average (EMA) as a stop. If in the last half hour of trading it looks like a position will close under the 21-day EMA, I’m usually selling whether it’s to take a loss or book a profit.
For short (or put) positions, I trade off a four-hour chart instead of a daily. Why? There’s a saying that stocks go up on an escalator and down on an elevator. Once a profitable trade starts to become oversold on the four-hour MACD, I start to take gains. Nothing like a short-covering rally to see your gains evaporate quickly, so I’m more proactive taking profits on short positions. I also use a 21-period EMA on the four-hour chart as a stop. If there is a close above the 21-period EMA, I tend to cover my short.
For updated charts, market analysis, and other trade ideas, give me a follow on Twitter: @mosaicassetco
Disclaimer: these are not recommendations and just my thoughts and opinions…do your own due diligence! I may hold a position in the securities mentioned in this post.


