

In this post, I’ll focus on setups that I’m monitoring for both long and short positions. With a chart and short write-up, this is a quick way to scan and plan potential trades.
These ideas are the end result of my process to identify stocks offering the right combination of growth fundamentals along with a proper chart setup.
Stock Market Update
Investors welcomed news of a partial government shutdown by pushing the S&P 500 to a new record high. After Congress failed to pass a new funding bill ahead of the U.S. government’s fiscal year that started on October 1, a shutdown is in place for the first time since 2018. The shutdown is expected to weigh on economic activity during its duration due to the potential impact on hundreds of thousands of furloughed federal workers. Key economic reports released by federal agencies will also be suspended, including this Friday’s scheduled September payrolls report. But looking back, federal government shutdowns have minimal impact on the stock market. During past shutdown episodes, the S&P 500 averaged a slight positive return during its duration.

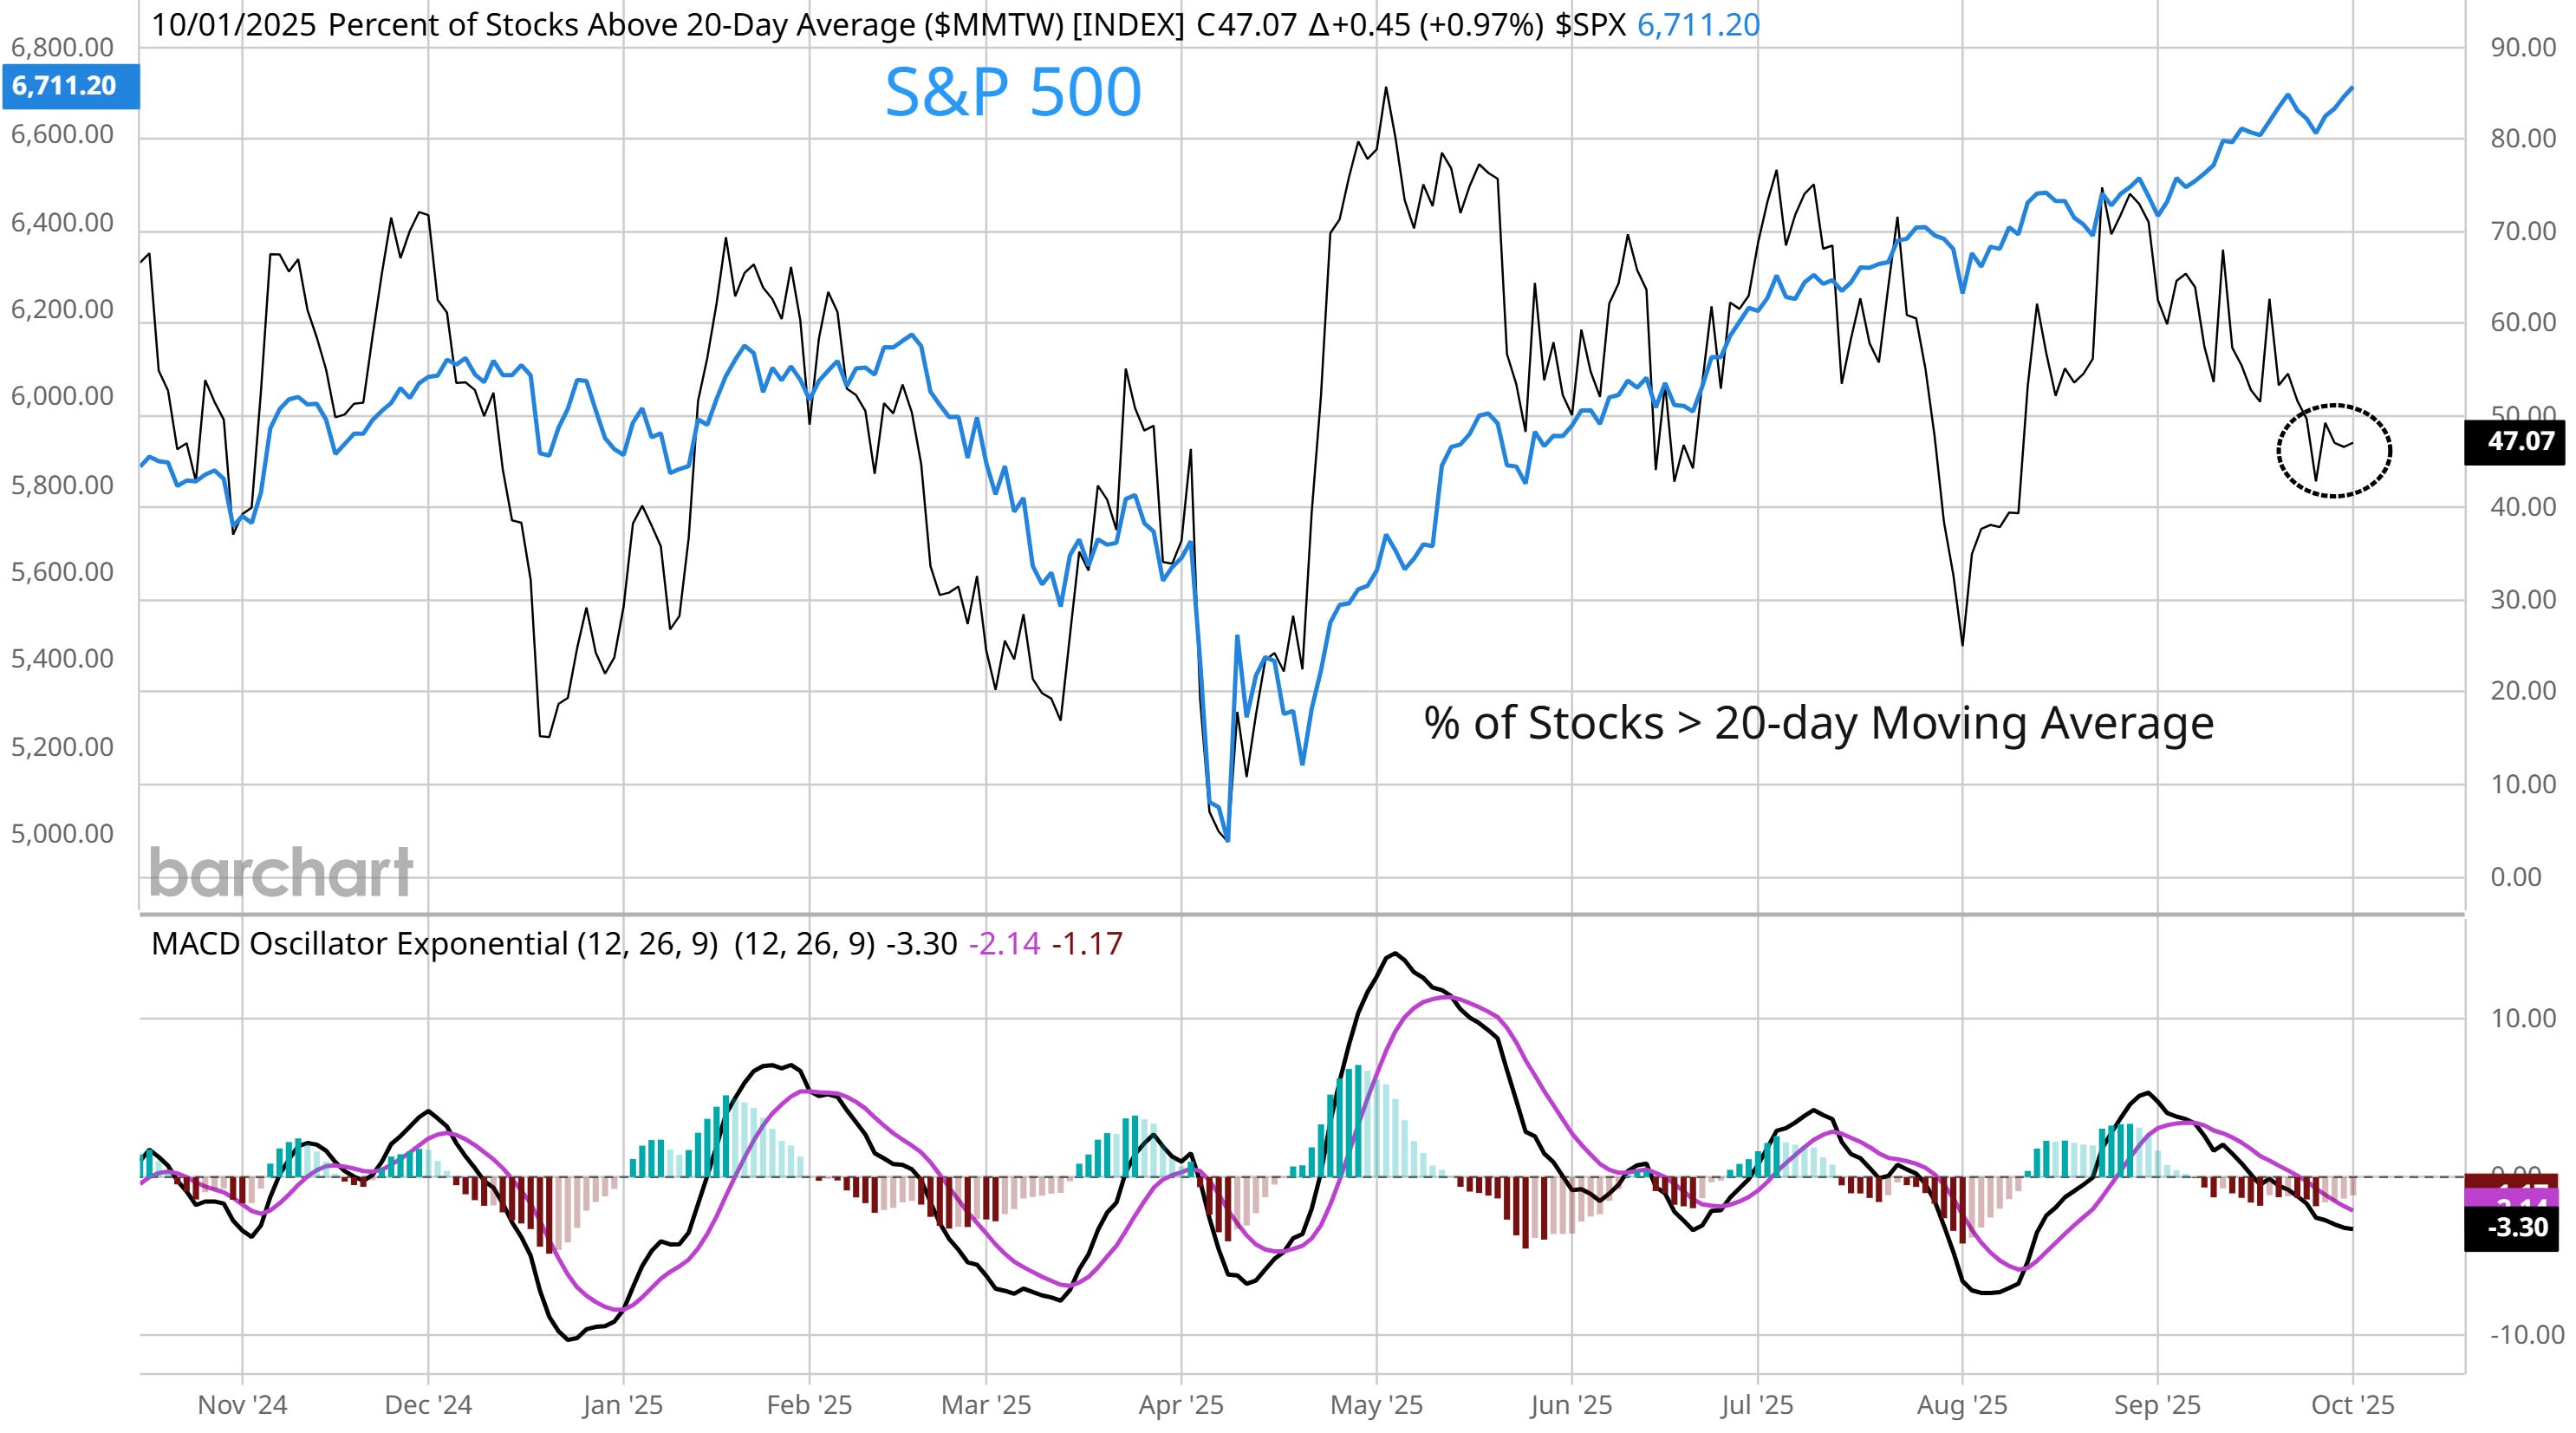
While developments around the shutdown will capture the headlines, a more concerning development should be with short-term breadth divergences. While the S&P 500 is making a fresh record high, only 47% of stocks across the major exchanges are trading in short-term uptrends. The chart below shows the percent of stocks trading above their 20-day moving average (MA). You can see that figure stands at just 47% despite the S&P at new highs, and has been steadily deteriorating since the end of August.
While participation in the market’s trend is a warning on the near-term outlook, conditions remain in place to support the rally into next year. The Fed is cutting interest rates into already loose financial conditions and evidence points to an economy that’s continuing to grow. That supports the earnings outlook and liquidity backdrop that tends to be supportive of asset prices. Keep reading to see:
Open ETF positions.
Open stock positions.
Chart analysis for new trade ideas.
