Welcome back to Mosaic Chart Alerts!
In this post, I’ll focus on setups that I’m monitoring for both long and short positions. With a chart and short write-up, this is a quick way to scan and plan potential trades.
These ideas are the end result of my process to identify stocks offering the right combination of fundamentals along with a proper chart setup.
Here are my notes from a focus list of setups I’m monitoring.
Stock Market Update
Developments on the macro front is the focus for investors this week. Updated reports on both consumer and producer inflation pointed to further moderation in price increases. The Consumer Price Index (CPI) logged a year-over-year gain of 4.0%, which was less than expected. While that’s still a high figure, it’s well off the 8.9% pace from last June with further deceleration expected in the months ahead. That’s because the producer measure (red line below) rose by just 1.1% in May, which is the lowest level since 2020 and could lead the CPI (blue line) lower still.
The better inflation reports comes on the heels of the fastest rate hiking campaign by the Federal Reserve ever, and was expected to give the central bank reason to pause. And while today’s meeting of the Fed’s FOMC rate-setting committee saw no interest rate increase for the first time in 15 months, the outlook from officials delivered a hawkish surprise. Updated estimates on the expected path of rates show more hikes happening before year-end, where the fed funds rate is now expected to finish 2023 at 5.6%. The updated “dot plot” below shows the March versus June fed funds rate projections from FOMC members. So despite the progress on the inflation front, the Fed doesn’t appear ready to declare a full pause just yet.
We’ll see how the stock market interprets the news over the next couple trading sessions, but the recent action under the hood has been undeniably better. Net new 52-week highs across major exchanges are holding onto positive territory for the first time since February, and breakouts are expanding across sectors. While it’s easy to get caught up in the headlines around inflation and the Fed, I try to stay focused on the action from my watchlist and execute my trade plan. And the good news is that there are plenty of stocks with strong fundamentals that are developing favorable chart setups on the long side. For the short watchlist, I’m removing SPT as recent price strength invalidates the pattern.
Keep reading below for all the updates…
Long Trade Setups
MBLY
Recent IPO trading mostly sideways since February. Gapped lower in April following earnings, but has recovered and recently tested resistance at the $47 level again. The MACD and relative strength (RS) line in a good position to support a breakout.
LTH
Trading in a tight range since late April, and now just below the post-IPO highs at around $22. Recent consolidation helped to rest the MACD, where a breakout over $21 resistance could lead to new highs.
SWAV
Price is currently consolidating after another test of the prior highs around $310. The MACD is turning up from zero while the RS line is holding near the highs. Impressive string of quarterly sales and earnings growth.
SKX
Tested the highs from 2021 at the $55 resistance level and pulled back toward the 50-day moving average. The $50 level was also good support from a prior breakout. Looking for a move to new highs.
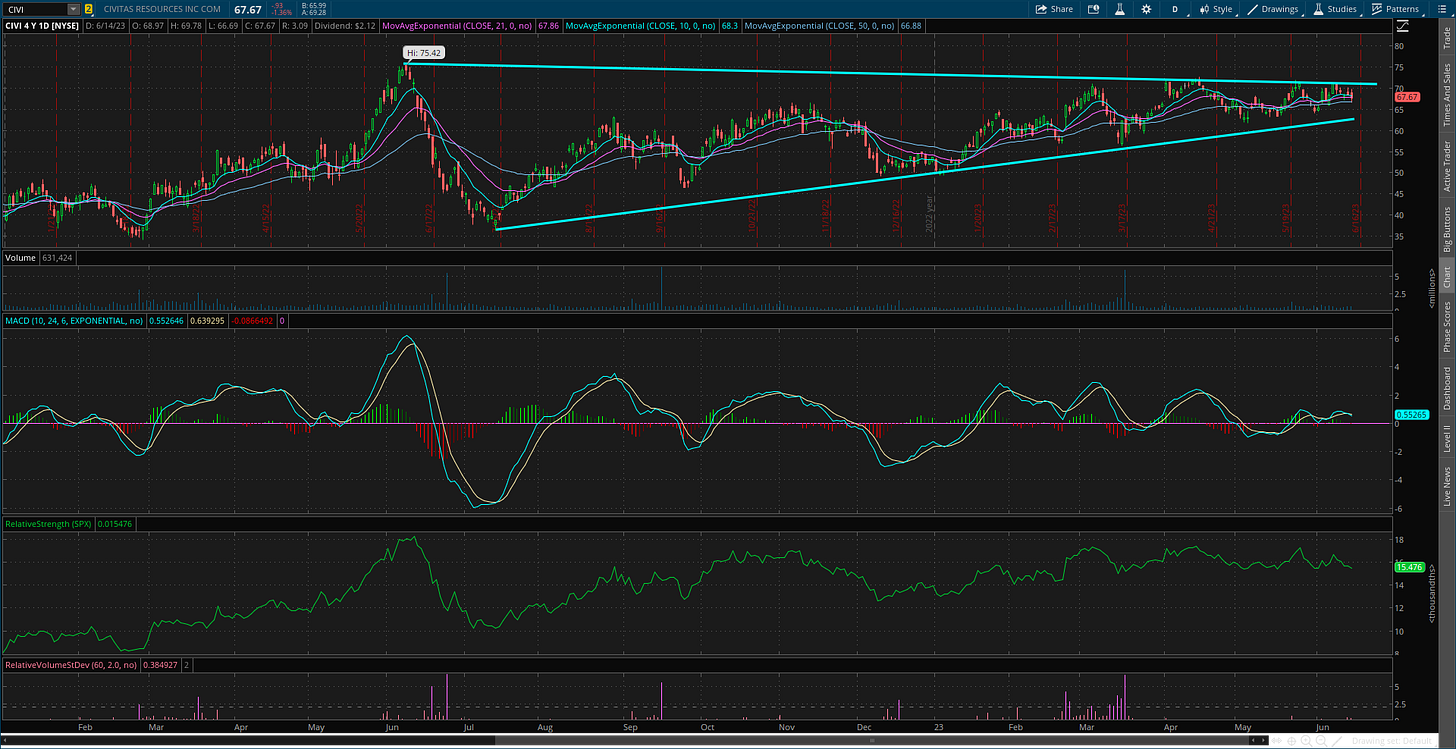
CIVI
Energy exploration and production company coming up to resistance of this triangle pattern. Watching if price can move above the $72 level followed by new all-time highs.
NOVT
Making a series of higher lows off the October bottom. Recently creating resistance around the $170 level, where a move above could target the prior highs.
NVGS
Trading in a consolidation pattern since last June, creating an ascending triangle. Very volatile price action over the past couple weeks, but will keep on watch for a breakout over the $15 level since it remains within the pattern.
Short Trade Setups
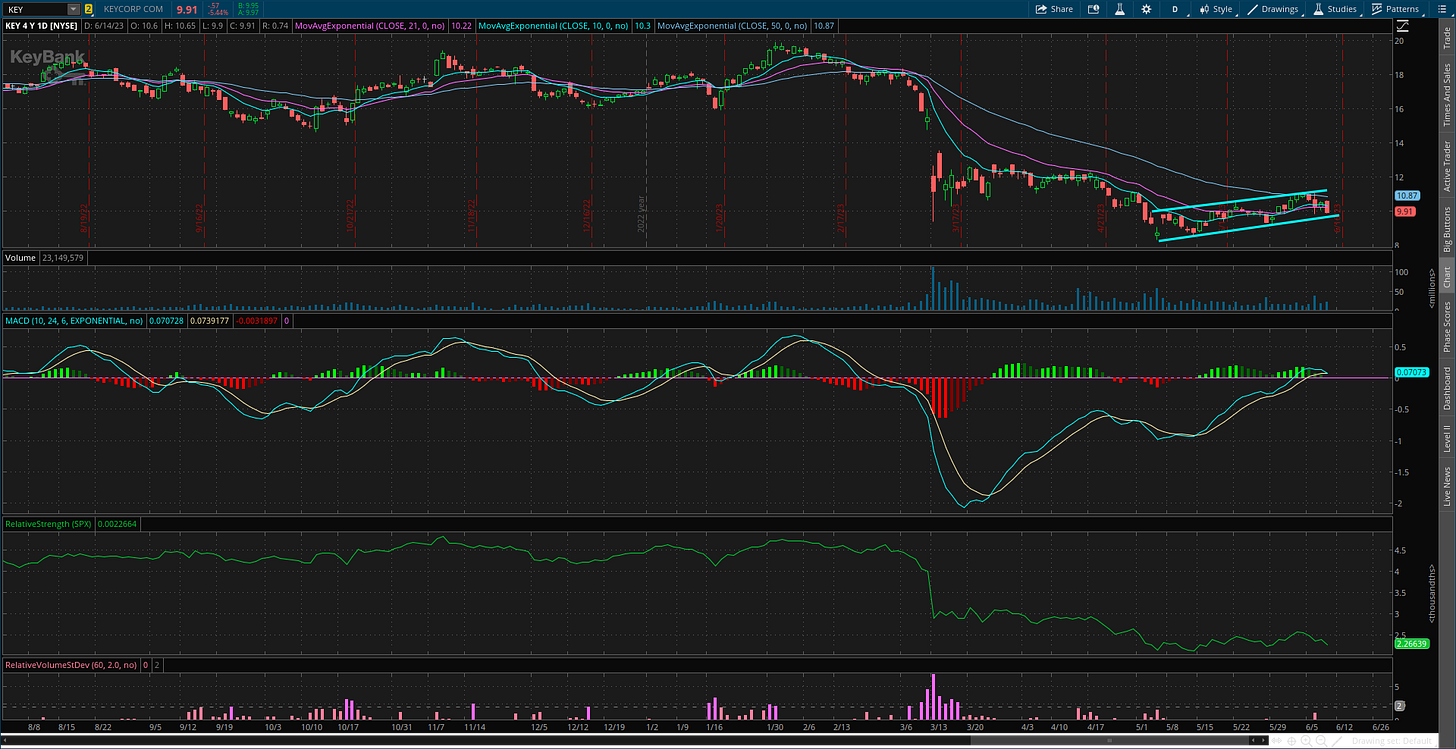
KEY
Creating a bear flag pattern with lower highs and lower lows since the February breakdown still intact. The MACD has reset at the zero line, and would prefer to see the RS line make a new low on breakdown from the pattern.
Rules of the Game
I trade chart breakouts based on the daily chart for long positions. And for price triggers on long setups, I tend to wait until the last half hour of trading to add a position. I find that emotional money trades the open, and smart money trades the close. If it looks like a stock is breaking out, I don’t want a “head fake” in the morning followed by a pullback later in the day.
I also use the RS line as a breakout filter. I find this improves the quality of the price signal and helps prevent false breakouts. So if price is moving out of a chart pattern, I want to see the RS line (the green line in the bottom panel of my charts) at new 52-week highs. Conversely, I prefer an RS line making new 52-week lows for short setups.
Also for long positions, I use the 21-day exponential moving average (EMA) as a stop. If in the last half hour of trading it looks like a position will close under the 21-day EMA, I’m usually selling whether it’s to take a loss or book a profit.
For short (or put) positions, I trade off a four-hour chart instead of a daily. Why? There’s a saying that stocks go up on an escalator and down on an elevator. Once a profitable trade starts to become oversold on the four-hour MACD, I start to take gains. Nothing like a short-covering rally to see your gains evaporate quickly, so I’m more proactive taking profits on short positions. I also use a 21-period EMA on the four-hour chart as a stop. If there is a close above the 21-period EMA, I tend to cover my short.
For updated charts, market analysis, and other trade ideas, give me a follow on Twitter: @mosaicassetco
Disclaimer: these are not recommendations and just my thoughts and opinions…do your own due diligence! I may hold a position in the securities mentioned in this post.


