In this post, I’ll focus on setups that I’m monitoring for both long and short positions. With a chart and short write-up, this is a quick way to scan and plan potential trades.
These ideas are the end result of my process to identify stocks offering the right combination of growth fundamentals along with a proper chart setup.
You can sign up for a 7-day free trial here to unlock the model portfolio and trade ideas in this report.
Stock Market Update
A strong risk-off move is hitting the more speculative areas of the capital markets and several of the market’s largest gainers in recent months. That includes cryptocurrencies, where Bitcoin has pulled back by 20% after hitting a record high over $106,000 back in January. In addition, five of the “Magnificent 7” have sliced through their 50-day moving average. The MAGS ETF that tracks the group is down 5% on the year. While the sharp pullback may appear as a large risk-off move, other areas that should be sensitive to developments around the economic outlook are holding up just fine. That includes the iShares iBoxx High Yield Corporate Bond ETF (HYG) which is breaking above a recent range in the chart below. HYG is moving out from a bullish inverse head and shoulders pattern, which puts the prior highs from September in sight.
For now, I’m treating the pullback in the S&P 500 as a pause in the uptrend versus viewing a major top in place. We’ve been tracking weak seasonality and other signs that stocks were due for a consolidation. But now conditions are evolving that can at least see a relief rally unfold over the near-term. Various measures of sentiment are showing a growing number of bearish investors. That includes CNN’s Fear & Greed Index, which is back in extreme fear territory (chart below). The most recent report from the AAII on retail investor sentiment shows the percent bearish at 60.6% compared to 40.5% last week. That’s the highest number of bears since 2022.
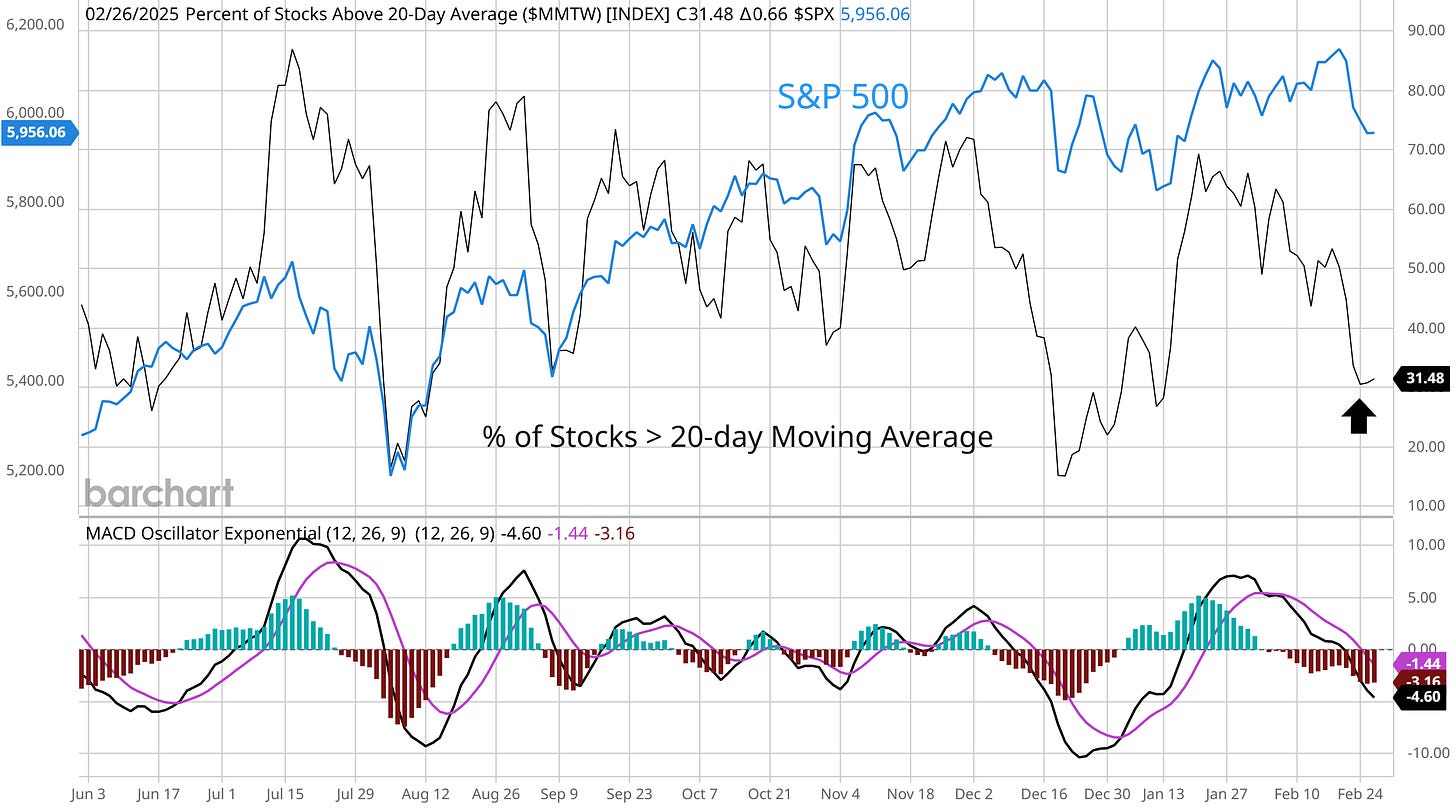
At the same time, some measures of market breadth are nearing oversold levels. That includes the percent of stocks trading above their 20-day moving average (MA) across the market. This metric originally flashed a negative breadth divergence as the S&P 500 was making a new high last week. But now the recent pullback has this measure at 31%. While that’s not quite to the 20% or lower threshold that serves as a reliable oversold indicator, it’s within range of oversold levels that have seen a bounce unfold on several occasions since last summer.
Keep reading below to see:
Open ETF positions.
Open stock positions.
Chart analysis for 7 trade ideas.


