

In this post, I’ll focus on setups that I’m monitoring for both long and short positions. With a chart and short write-up, this is a quick way to scan and plan potential trades.
These ideas are the end result of my process to identify stocks offering the right combination of growth fundamentals along with a proper chart setup.
Stock Market Update
While the Federal Reserve reduced short-term interest rates by a quarter point at its most recent meeting as widely expected, there are questions surrounding the outlook for more cuts. Fed Chair Jerome Powell noted that another rate cut in December is “note a forgone conclusion” as deep divisions remain over the pace of easing given persistently high levels of inflation.
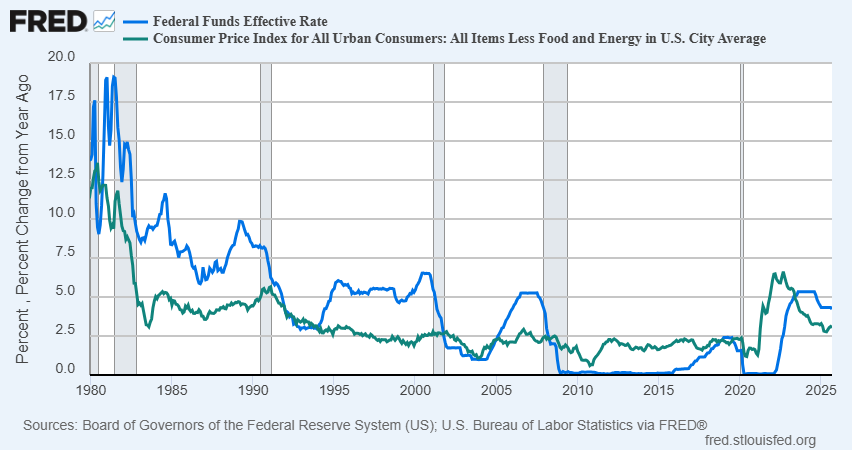
I would also note the circumstances behind the cut are also a bit puzzling given Powell’s comments and the meeting statement. The meeting statement added language noting that “economic activity has been expanding at a moderate pace.” Powell also acknowledged inflationary pressures from tariffs at a time when core consumer inflation has held around 3% for over year now. The neutral level of the fed funds rate has also historically been around 100 basis points higher than consumer inflation, which is around the current level of short-term rates. The chart below compares fed funds (blue line) to the core Consumer Price Index (green line) going back to 1980.
Regardless of any uncertainty over the outlook for further rate cuts, the conditions supporting the stock market rally remain intact. Financial conditions were already looser than average before the Fed resumed cutting interest rates in September, and even the central bank is now noting underlying strength in the economy (something I’ve been highlighting). Rate cuts following an extended pause of six months or longer tends to see strong forward returns for the S&P 500 (chart below), with the S&P also entering a favorable stretch of seasonality over multiple time frames.

Overall conditions remain supportive of the bull market into next year, which should produce a constructive trading backdrop. I have several additions and updates to our watchlist of breakout setups. Keep reading to see:
Open ETF positions.
Open stock positions.
Chart analysis for new trade ideas.
