

In this post, I’ll focus on setups that I’m monitoring for both long and short positions. With a chart and short write-up, this is a quick way to scan and plan potential trades.
These ideas are the end result of my process to identify stocks offering the right combination of growth fundamentals along with a proper chart setup. Live alerts are sent to Traders Hub members only.
Stock Market Update
A batch of better than expected economic reports is setting up a highly anticipated May payrolls report. Updated surveys on manufacturing and service sector activity from the ISM saw growth accelerate in May compared to April while leading indicators of activity jumped as well. The new orders component of the manufacturing survey was reported at 56.8 while services jumped to 57.3. The surveys are constructed so that a reading above 50 indicates expansion. This week also saw an updated JOLTS report covering the month of April, which showed job openings surging to 7.6 million jobs during the month and is the highest level of openings in nearly two years. The jump in job openings is another confirming indicator on the earnings outlook, where the rate of change closely tracks corporate profits (chart below).

While business surveys and job openings is another tailwind for the earnings outlook, the data is putting more pressure on the Federal Reserve and its policy stance. In the same ISM surveys, measures of prices paid remain near extremely elevated levels which tends to lead inflation. If the payrolls report for the month of May confirms underlying strength in the economy and labor market, the outlook for monetary policy will grow more uncertain given the recent jump in consumer and producer inflation. At the same time, evidence of solid economic activity is helping the average stock catch up to the gains in the S&P 500 and Nasdaq. The chart below plots the NYSE cumulative advance/decline line and is a way to track the average stock. The A/D line has been lagging cap-weighted indexes in breaking out to new highs, but is closing in on new high ground.
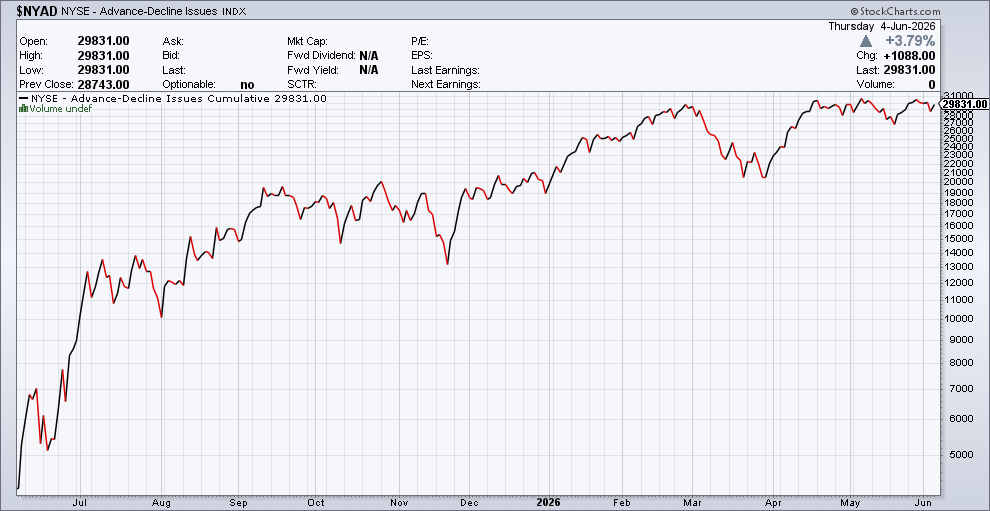
More constructive action in the average stock as evidenced by the A/D line is creating more trade setups to add to the watchlist. Current open positions in high growth themes continue to hold above key moving averages, so we’ll keep trailing those holdings. Keep reading to see:
Open ETF positions.
Open stock positions.
Chart analysis for new trade ideas.
