

In this post, I’ll focus on setups that I’m monitoring for both long and short positions. With a chart and short write-up, this is a quick way to scan and plan potential trades.
These ideas are the end result of my process to identify stocks offering the right combination of growth fundamentals along with a proper chart setup.
You can sign up for a 7-day free trial here to unlock the model portfolio and trade ideas in this report.
Stock Market Update
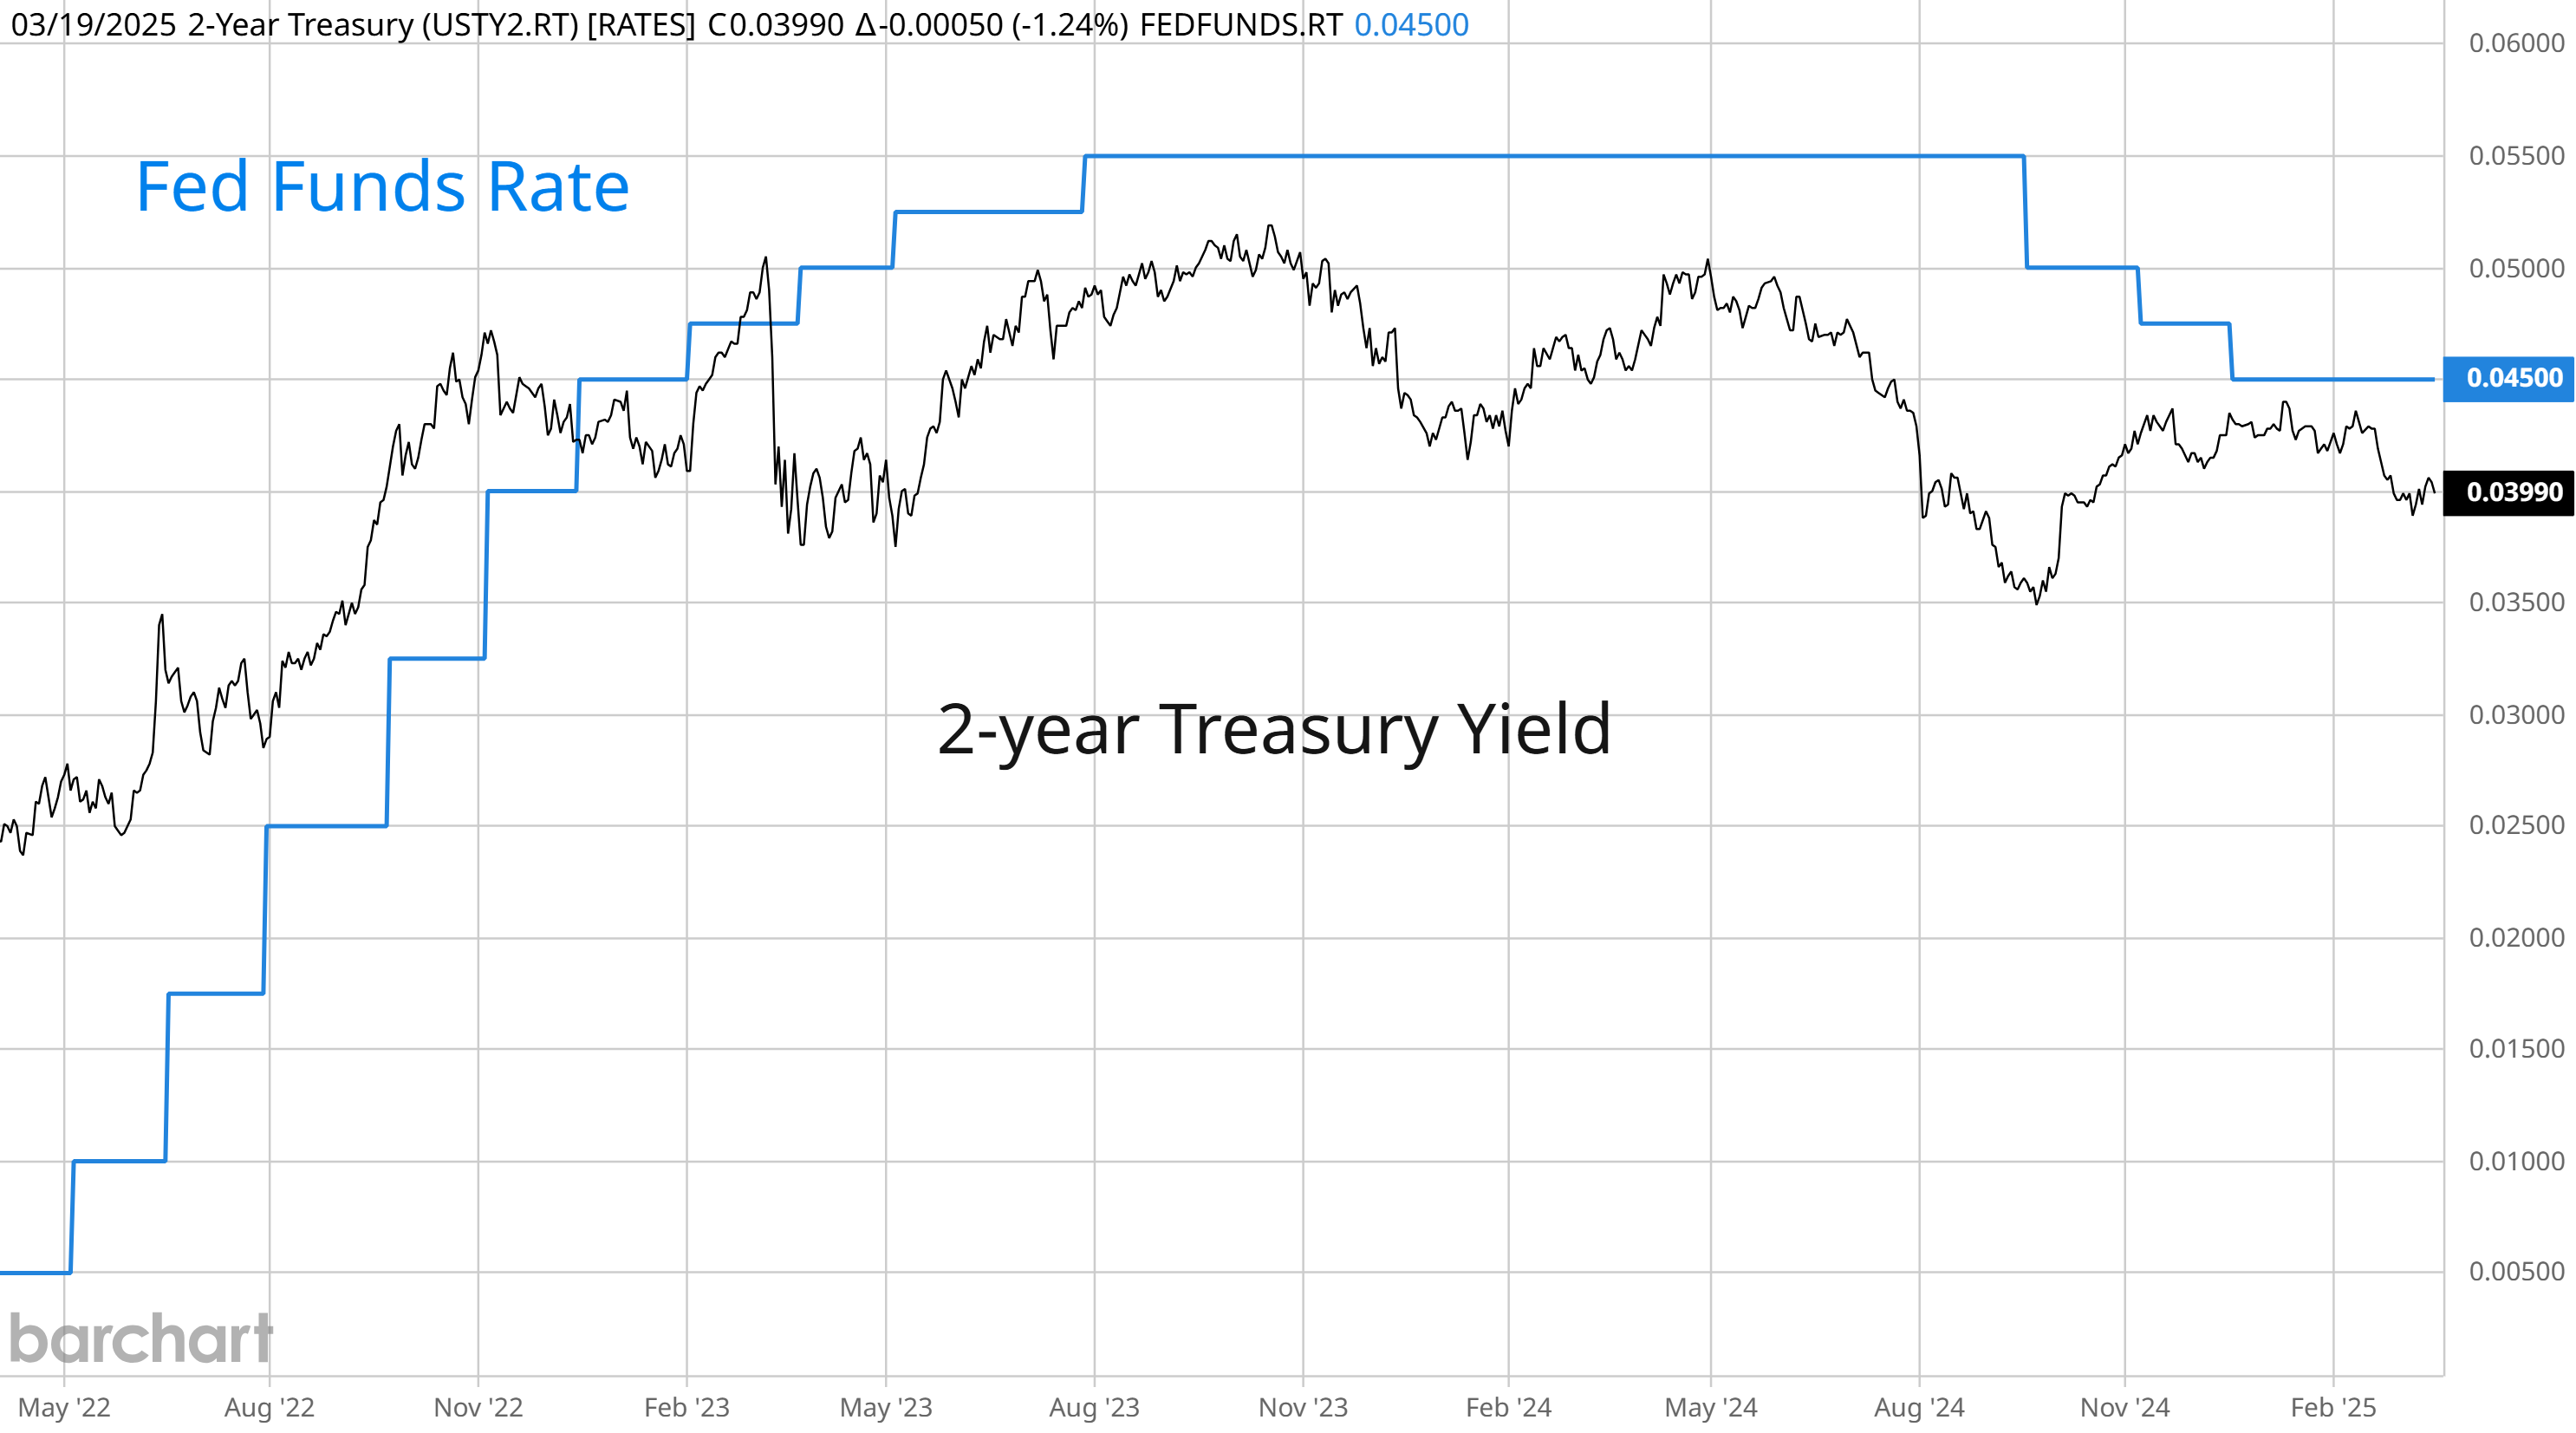
Following its latest rate-setting meeting, the Federal Reserve kept the fed funds rate unchanged at a range of 4.25-4.50%. While the move to keep rates steady was widely expected, changes in the central bank’s economic outlook and the future path of rates were in focus. In their updated economic projections, the Fed downgraded forecasts for economic growth while raising inflation estimates. Following the meeting and Fed Chair Jerome Powell’s press conference, market-implied odds continue pointing to two quarter point rate cuts this year. That’s also consistent with the 2-year Treasury yield, which is 50 basis points below the current level of fed funds. The 2-year tends to lead changes in fed funds as you can see in the chart below.
While shifting Fed forecasts is likely to generate plenty of “stagflation” headlines, it’s worth noting that conditions remain in place favoring a rally. Oversold market breadth and bearish investor sentiment surveys were among the first indicators becoming bullish. Now we’re also seeing more confirmation with positioning data and fund flows. The CBOE put/call ratio jumped above 0.90 last week, which historically indicates elevated fear in option volumes. Fund managers have also cut U.S. equity exposure by the largest amount on record. The BofA Fund Manager Survey showed the largest monthly cut to U.S. equity allocations ever, which now sits at the largest underweight since the bank crisis in March 2023 (chart below).

We’re also seeing early evidence of improving breadth. That includes last week’s 9/1 reading on the NYSE Advance/Decline ratio. The S&P 500 also had back-to-back sessions with 90% advancing issues, which historically has positive implications for forward returns. Better traction in the average stock is showing up in constructive chart action as well. We’ve initiated several new positions over the past week to take advantage, which is updated in the model portfolio below. Keep reading to see:
Open ETF positions.
Open stock positions.
Chart analysis for new trade ideas.
