Welcome back to Mosaic Chart Alerts!
In this post, I’ll focus on setups that I’m monitoring for both long and short positions. With a chart and short write-up, this is a quick way to scan and plan potential trades.
These ideas are the end result of my process to identify stocks offering the right combination of growth fundamentals along with a proper chart setup.
Here are my notes from a focus list of setups I’m monitoring.
Stock Market Update
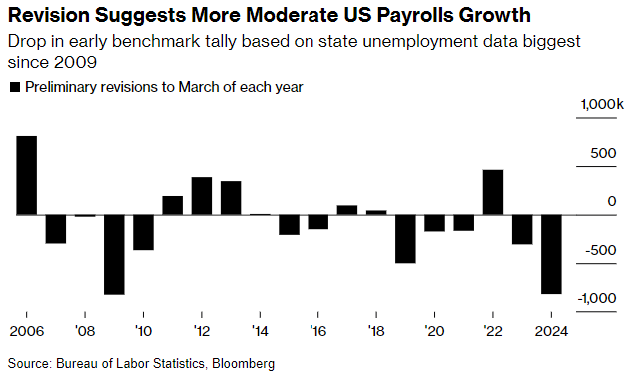
A dismal update on the labor market is increasing pressure on the Federal Reserve to start cutting interest rates. An annual revision to payrolls data showed that there were 818,000 fewer jobs created in the 12 month period to March than previously estimated. Such large negative revisions are usually seen coming out of recessions, with this revision being the largest since 2009 in the aftermath of the financial crisis (chart below). The disappointing report will increase scrutiny on Fed Chair Jerome Powell and his speech to be delivered at Jackson Hole on Friday.
In recent years, Powell has used the Jackson Hole Symposium for broadcasting pivots in monetary policy. This year, investors and economists will be looking for details on the magnitude and speed of an interest rate cutting cycle that’s expected to start at the Fed’s meeting in September. The evolving outlook for interest rates is already being felt across the capital markets. The 2-year Treasury yield, which tends to lead changes in the fed funds rate, has dropped to 3.92% from 4.77% since the beginning of July. Falling yields are helping boost gold prices to fresh record highs.
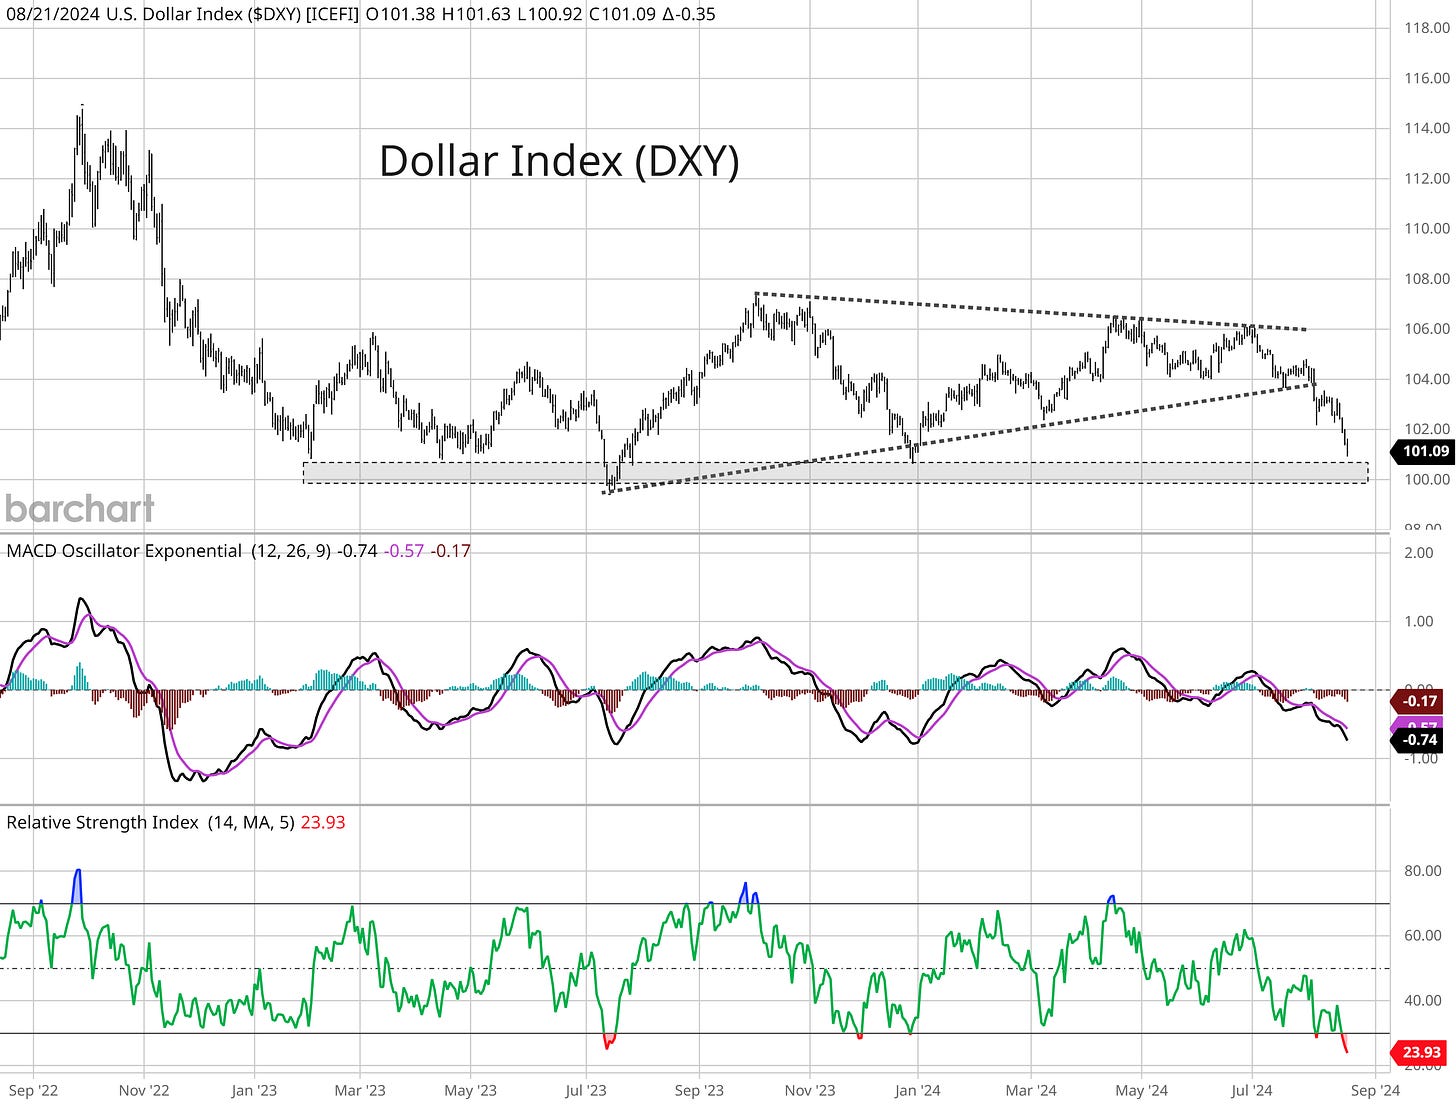
But perhaps the most important looming chart development (that’s not receiving much attention) is with the U.S. Dollar Index (DXY). The interest rate outlook is weighing on the dollar, and you can see in the chart below that the dollar broke down from a symmetrical triangle pattern. DXY is now testing a support area at the 100 level (shaded area) that’s held since early 2023. A break below could signal another big move lower, which could be a near-term tailwind for commodities and corporate earnings.
As rate cuts come into view, the S&P 500 has continued recovering from the selloff that culminated with a historic surge in volatility during the first week of August. While the S&P is trading just below its prior peak, many stocks across the market have already been breaking out to fresh 52-week highs. Those names showing relative strength and breaking out from sound basing patterns ahead of the major indexes are the stocks that deserve your attention. This week, I’m removing RACE and BIRK from the watchlist as each stock breaks out to complete their chart setup. I also have a couple new additions to the list.
Keep reading below for all the updates…
Long Trade Setups
CYBR
Trading sideways since February while testing resistance at the $280 level on three occasions. Price is now back near the $280 level, where I would like to see one more smaller pullback that resents the MACD at the zero line before breaking out. The relative strength (RS) line is also holding near the high.
GE
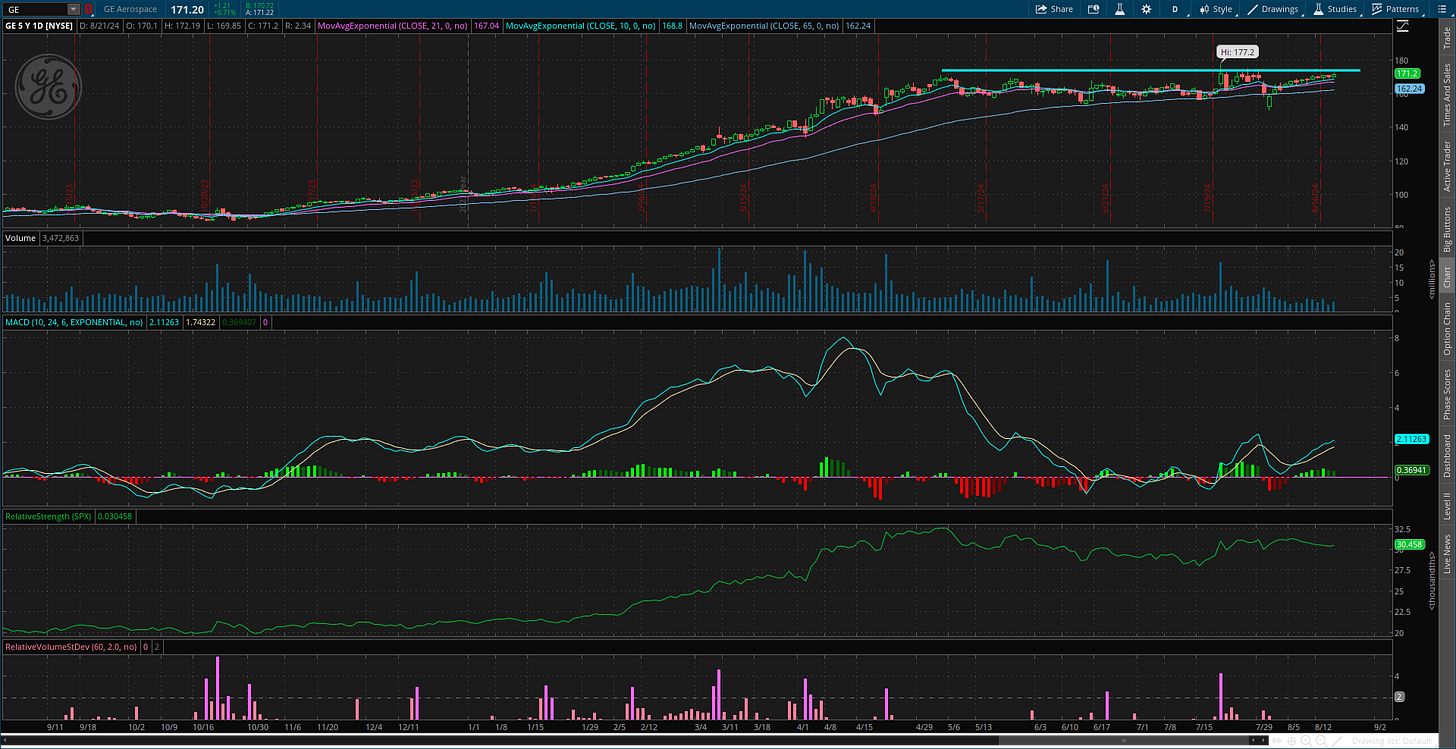
Trading in a tight sideways pattern since May while testing resistance near the $175 level several times. The RS line holding near the highs as the MACD is turning higher from a reset. Watching for a move over $175.
ONON
After breaking out over a larger basing pattern, price is now forming a “base on base”. Following a move over $35 in May, the stock peaked at $44 and is now back testing $35 as support. Would like to see one more smaller pullback before trying to move over $44.
NOW
Trading in a basing pattern since topping near the $810 level back in February. Recently making a series of smaller pullbacks with resistance now at $830. Watching for a breakout with the RS line at new highs.
TAYD
Peaked at the $60 level after moving out of a large base in January. Consolidating gains since April, with an initial resistance level to monitor at the $53 level. Need to see the MACD turn up and stay above zero.
LNW
Good basing action after the stock peaked just under $110 in March. Price is recently retesting that level after getting one smaller pullback that reset the MACD at the zero line. That sets up a move to new highs over $110.
FG
Broke out of a base back in November and rallied to the $48 area. Consolidating gains since the start of the year and recently rallying back toward $48. Want to see price hold support at the $35 area on any pullback.
PDD
Trading in a consolidation pattern going back to December and recently working up the right side of the base. That move left the MACD extended, and would like to see one more MACD reset at zero. Looking for a move over $160 with confirmation by the RS line.
Rules of the Game
I trade chart breakouts based on the daily chart for long positions. And for price triggers on long setups, I tend to wait until the last half hour of trading to add a position. I find that emotional money trades the open, and smart money trades the close. If it looks like a stock is breaking out, I don’t want a “head fake” in the morning followed by a pullback later in the day.
I also use the RS line as a breakout filter. I find this improves the quality of the price signal and helps prevent false breakouts. So if price is moving out of a chart pattern, I want to see the RS line (the green line in the bottom panel of my charts) at new 52-week highs. Conversely, I prefer an RS line making new 52-week lows for short setups.
Also for long positions, I use the 21-day exponential moving average (EMA) as a stop. If in the last half hour of trading it looks like a position will close under the 21-day EMA, I’m usually selling whether it’s to take a loss or book a profit.
For short (or put) positions, I trade off a four-hour chart instead of a daily. Why? There’s a saying that stocks go up on an escalator and down on an elevator. Once a profitable trade starts to become oversold on the four-hour MACD, I start to take gains. Nothing like a short-covering rally to see your gains evaporate quickly, so I’m more proactive taking profits on short positions. I also use a 21-period EMA on the four-hour chart as a stop. If there is a close above the 21-period EMA, I tend to cover my short.
For updated charts, market analysis, and other trade ideas, give me a follow on X: @mosaicassetco
Disclaimer: these are not recommendations and just my thoughts and opinions…do your own due diligence! I may hold a position in the securities mentioned in this post.


Nifty chart setups! I've been keeping my eye on GE too. Let's see what happens with Jay!