In this post, I’ll focus on setups that I’m monitoring for both long and short positions. With a chart and short write-up, this is a quick way to scan and plan potential trades.
These ideas are the end result of my process to identify stocks offering the right combination of growth fundamentals along with a proper chart setup.
Stock Market Update
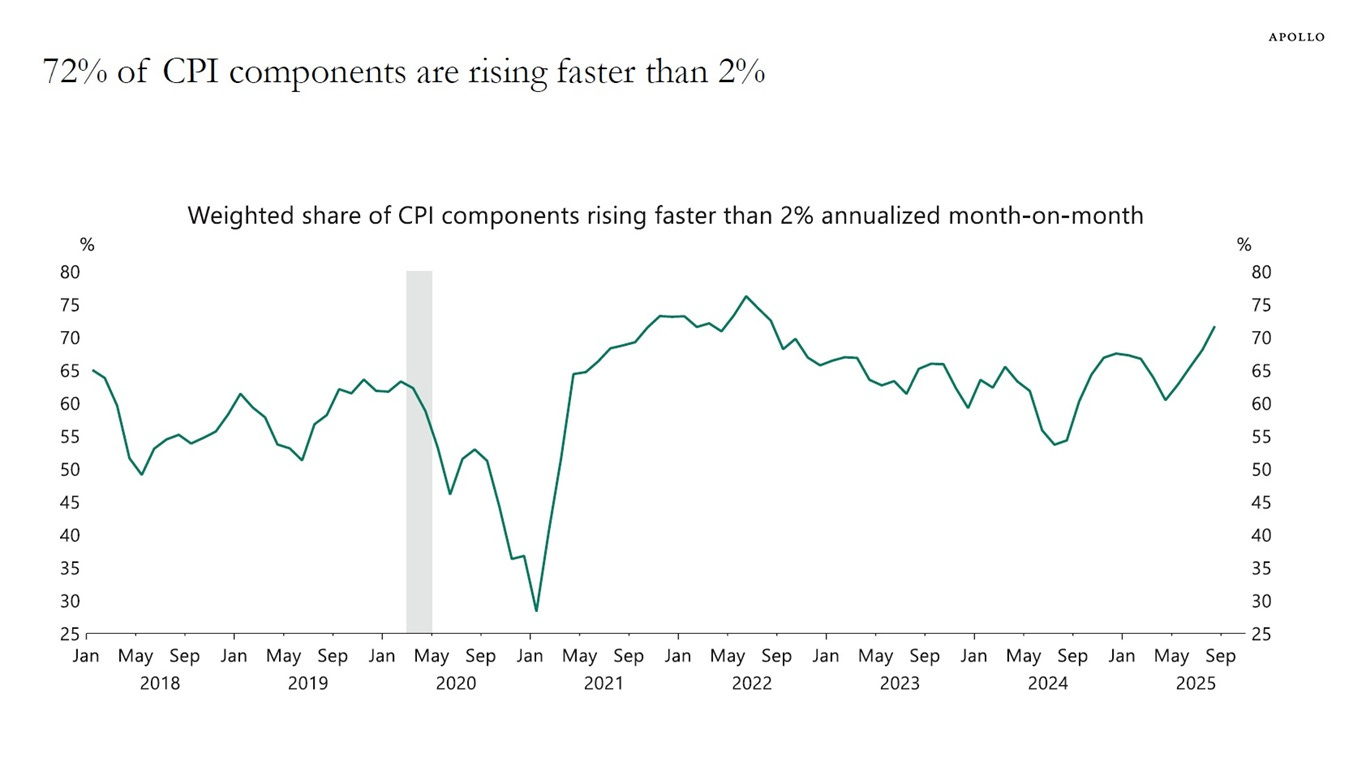
Just one week after the Federal Reserve cut interest rates by a quarter point, the outlook for further rate cuts is becoming cloudy. Fed Chair Jerome Powell said in a speech this week that there is no risk-free path given current challenges to both labor market weakness and ongoing inflation concerns. Powell also noted that interest rates are in a good place to deal with either threat, which makes it sound like the Fed will not lower rates much further pending incoming data. Market-implied odds are tempering expectations for further cuts a bit, with four 0.25% cuts now expected over the coming year. Inflation that’s running well above the Fed’s 2% target could be a limiting factor on total rate cuts. The chart below shows that 72% of the components in the Consumer Price Index (CPI) are rising faster than 2% which is the highest since the last inflation wave in 2022 (chart below).
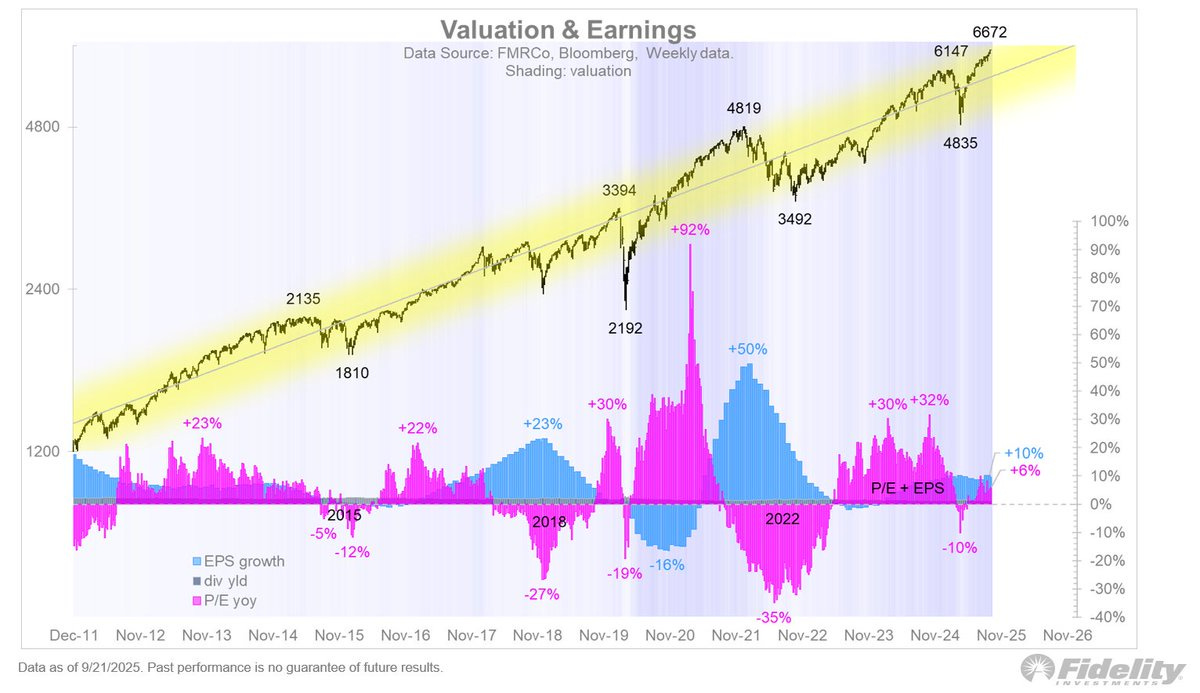
While the outlook for rates might not be as favorable as a week ago, conditions remain in place to help drive the bull market into year end. Market odds are still pricing a 92% chance that the Fed cuts another 0.25% at its next meeting in October, which comes at a time when financial conditions are already loose and the economy is showing signs of accelerating. That’s a positive backdrop for the earnings outlook, which is needed to keep the rally on track. The chart below shows the S&P 500 along with the contribution coming from P/E multiple expansion (pink bars) and earnings growth (blue bars). Multiple expansion was an early driver of returns in this cyclical bull market, with earnings growth driving a larger share over the past year.
We’re holding positions and continue to track setups across numerous themes including artificial intelligence, nuclear, gold, and fintech. It’s tempting to chase less than ideal setups in an easy trading environment, but staying disciplined to our strategy remains critical to identify the right stocks breaking out. Keep reading to see:
Open ETF positions.
Open stock positions.
Chart analysis for new trade ideas.


