

In this post, I’ll focus on setups that I’m monitoring for both long and short positions. With a chart and short write-up, this is a quick way to scan and plan potential trades.
These ideas are the end result of my process to identify stocks offering the right combination of growth fundamentals along with a proper chart setup.
Stock Market Update
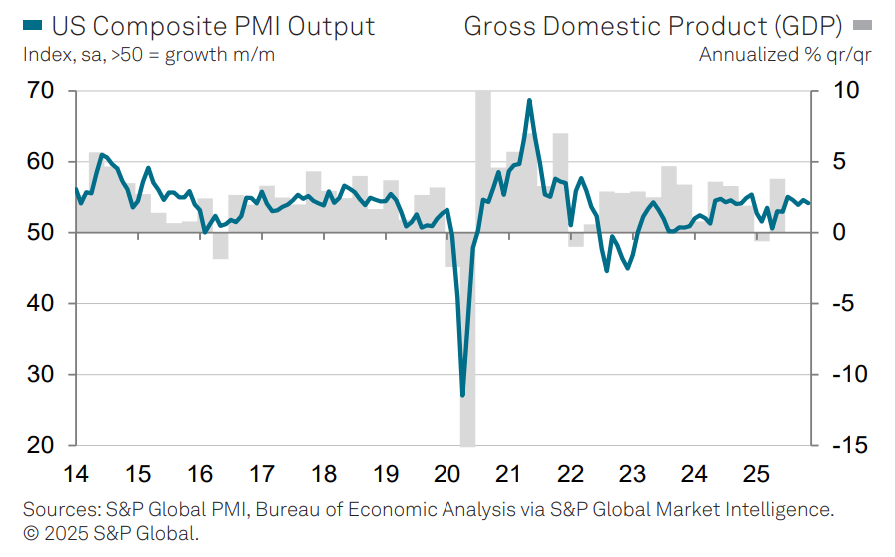
A report covering the manufacturing and services sector of the economy is portraying strong output with demand picking up. S&P Global’s US Composite PMI was reported at 54.2 in November which was a slight drop from October’s reading. But a level above 50 signals expanding economic activity, and aligns with solid expected GDP growth historically (chart below). The report also noted that activity in the services sectors was supported by the strongest increase in new business volumes since last December. But not all underlying components were positive, with the prices paid figure jumping to the highest level in six months. Various PMI reports continue to warn of inflationary pressures building.
Along with other economic reports and inflation data due this week, that sets the stage for a highly anticipated Federal Reserve rate-setting meeting next week. While market-implied odds point to an 89% chance of a third consecutive rate cut, deep divisions are emerging on the forward path of interest rates. While that could inject volatility into the stock market, underlying market internals are evolving very favorably for a rally into year-end. Strong breadth on the recent rebound is driving indicators of the average stock to new highs ahead of the cap-weighted indexes. In addition to breadth thrusts, strong gains across the average stock is creating momentum thrusts as well. The chart below looks at the percent of stocks in the Nasdaq Composite with a MACD buy signal. That figure has surged to the highest level since coming off the trade war selloff, and historically has preceded a strong period of forward returns.

I continue to believe the stage is set for a rally into year-end, though the Fed meeting could create uncertainties on the rate outlook as there is little reason to keep cutting interest rates. It’s also worth noting that historic December seasonality is choppy during the first half of the month before giving way to rising price levels for the S&P 500.
Keep reading to see:
Open ETF positions.
Open stock positions.
Chart analysis for new trade ideas.
