

Welcome back to Mosaic Chart Alerts!
In this newsletter, I’ll focus on the best setups that I’m monitoring for both long and short positions. With a chart and short write-up, this is a quick way to scan and plan potential trade ideas.
And to select these ideas, a lot of work goes on behind the scenes to find stocks offering the right combination of fundamental attributes along with a proper chart setup.
These are my notes from a shortlist of setups I’m monitoring.
Weekly Recap
Just like last Wednesday, stocks are sharply higher mid-week. This time, a cooler than expected consumer inflation report has the market lowering the odds of another 75 basis point rate hike at the next FOMC meeting. Needless to say, the broader market action is doing favors for our breakout setups. Our list of prior breakouts are still showing nice momentum, including ENPH, GPC, and DY. EVH also broke above our key price level, and is in the process of back testing support. This week, I’m going to remove KNSL from our watchlist, as the stock has taken out the key levels that I laid out recently (see the end of this newsletter for how I manage open positions). In this week’s The Market Mosaic, I noted this was one of my favorite long setups. I’m also going to remove HALO from the watchlist. This stock never triggered a trade, and has fallen below the 50-day moving average. That’s not the kind of action I expect to buy! I’m also removing U and TTD from our short setups, as the rally in both stocks has invalidated their patterns. With this week’s activity, I have added several new stocks to both our long and short watchlist.
Long Trade Setups
CAL
New addition to the watchlist. Setting up for a breakout over $30, which is my trigger level. Long base that has been tightening its range since June, creating a bull flag pattern.

JKS
New addition to the watchlist. Weekly chart below to show the significance of the $75 level. Solar stocks working well lately, but note the risk around China-based names so position size accordingly on a breakout.

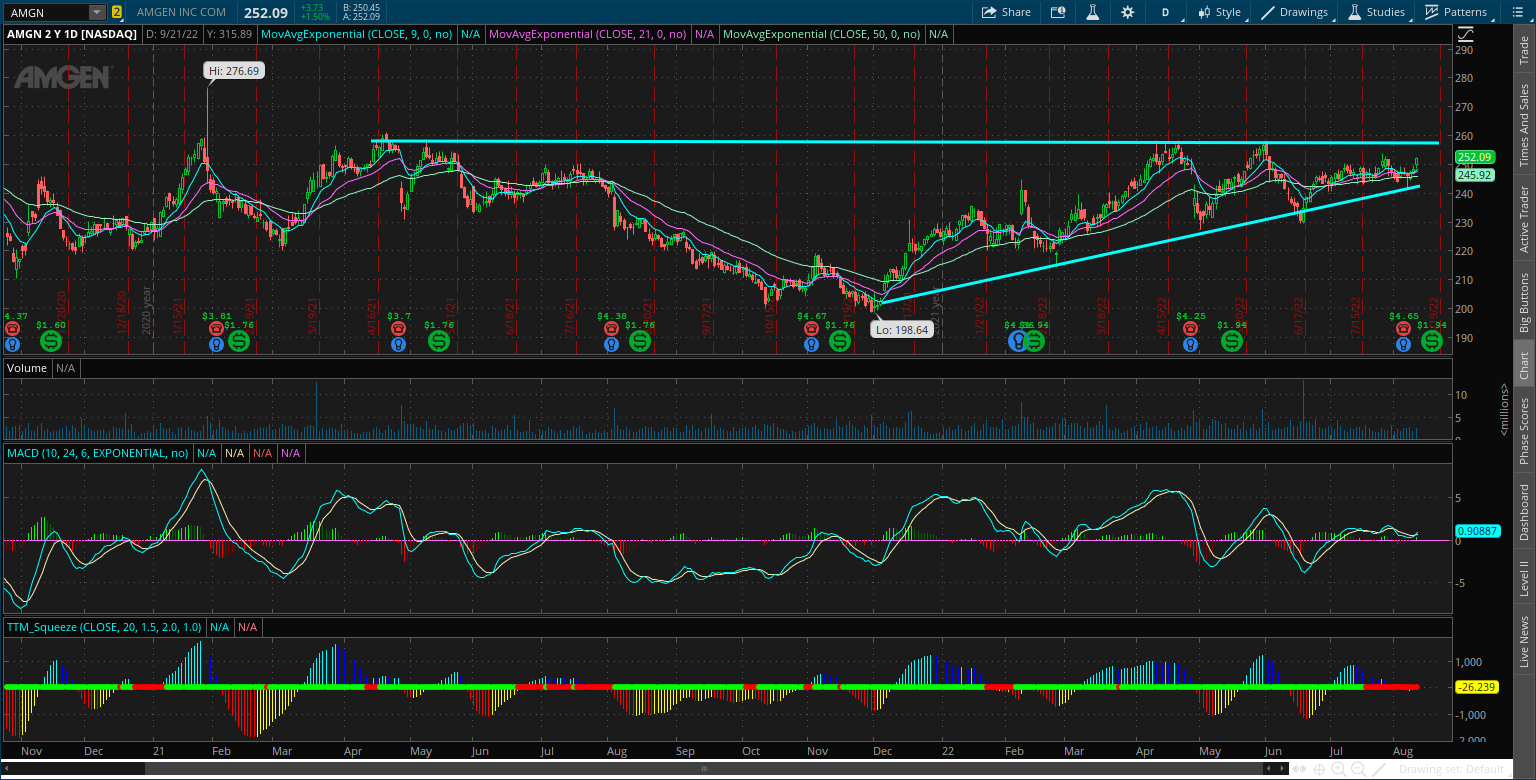
AMGN
Still keeping $260 as the level to watch here. Looking for a break above that resistance with this ascending triangle pattern that has been forming since last year. With the earnings catalyst behind us, trading in this pattern remains constructive for a breakout.
DNOW
Keeping this one on the watchlist. Forming an ascending triangle going back to March 2021, while still trading right below the $12 resistance level. I noted last week that it’s possible to see a pause before attempting to breakout, which is my preferred scenario and exactly what’s happening.

GEF
Another recent addition to the watchlist. Noted last week that my preference was to see the stock consolidate following the recent move off $60. We’ve had some basing action over the last week, and now the stock is testing the $70-$71 resistance level today.

Short Trade Setups
WDC
Potentially carving out a head and shoulders downside continuation pattern. I’ll be interested in this setup as long as the stock remains below the $50 level, with $45 being my initial trigger.

NIO
Earnings coming up with this one. Keeping it simple – watching for a close below $19 where I would expect a move back to $15.

Rules of the Game
If you haven’t noticed yet, I trade breakouts! I trade based on the daily chart for long positions. And for price triggers on long setups, I tend to wait until the last half hour of trading to add a position. I find that emotional money trades the open, and smart money trades the close. If it looks like a stock is breaking out, I don’t want a “head fake” in the morning followed by a pullback later in the day.
Also for long positions, I use the 21-day exponential moving average (EMA) as a stop. If in the last half hour of trading it looks like a position will close under the 21-day EMA, I’m usually selling whether it’s to take a loss or book a profit.
For short (or put) positions, I trade off a four-chart instead of a daily. Why? There’s a saying that stocks go up on an escalator and down on an elevator. Once a profitable trade starts to become oversold on the four-hour MACD, I start to take gains. Nothing like a short-covering rally to see your gains evaporate quickly, so I’m more proactive taking profits on short positions. I also use a 21-period EMA on the four-hour chart as a stop. If there is a close above the 21-period EMA, I will cover my short.
For updated charts, market analysis, and other trade ideas, give me a follow on twitter: @mosaicassetco
Disclaimer: these are not recommendations and just my thoughts and opinions…do your own due diligence! I may hold a position in the securities mentioned in this newsletter.