

In this post, I’ll focus on setups that I’m monitoring for both long and short positions. With a chart and short write-up, this is a quick way to scan and plan potential trades.
These ideas are the end result of my process to identify stocks offering the right combination of growth fundamentals along with a proper chart setup. Live alerts are sent to Traders Hub members only.
Stock Market Update
Bond market volatility is pressuring the stock market, except for the biggest stocks. An ETF tracking the “Magnificent 7” broke out to new records highs last week driven by a surge in Meta Platforms following their new AI agent. That’s helping prop up the S&P 500 and Nasdaq which are both trading just below their respective record highs. But it’s a much different story under the hood, where the average stock is pulling back. The percent of stocks across the market trading above their 20-day moving average (MA) stands at just 29%. There have also been more stocks making new 52-week lows than new highs across major exchanges since the end of August that you can see in the chart below tracking net new highs.
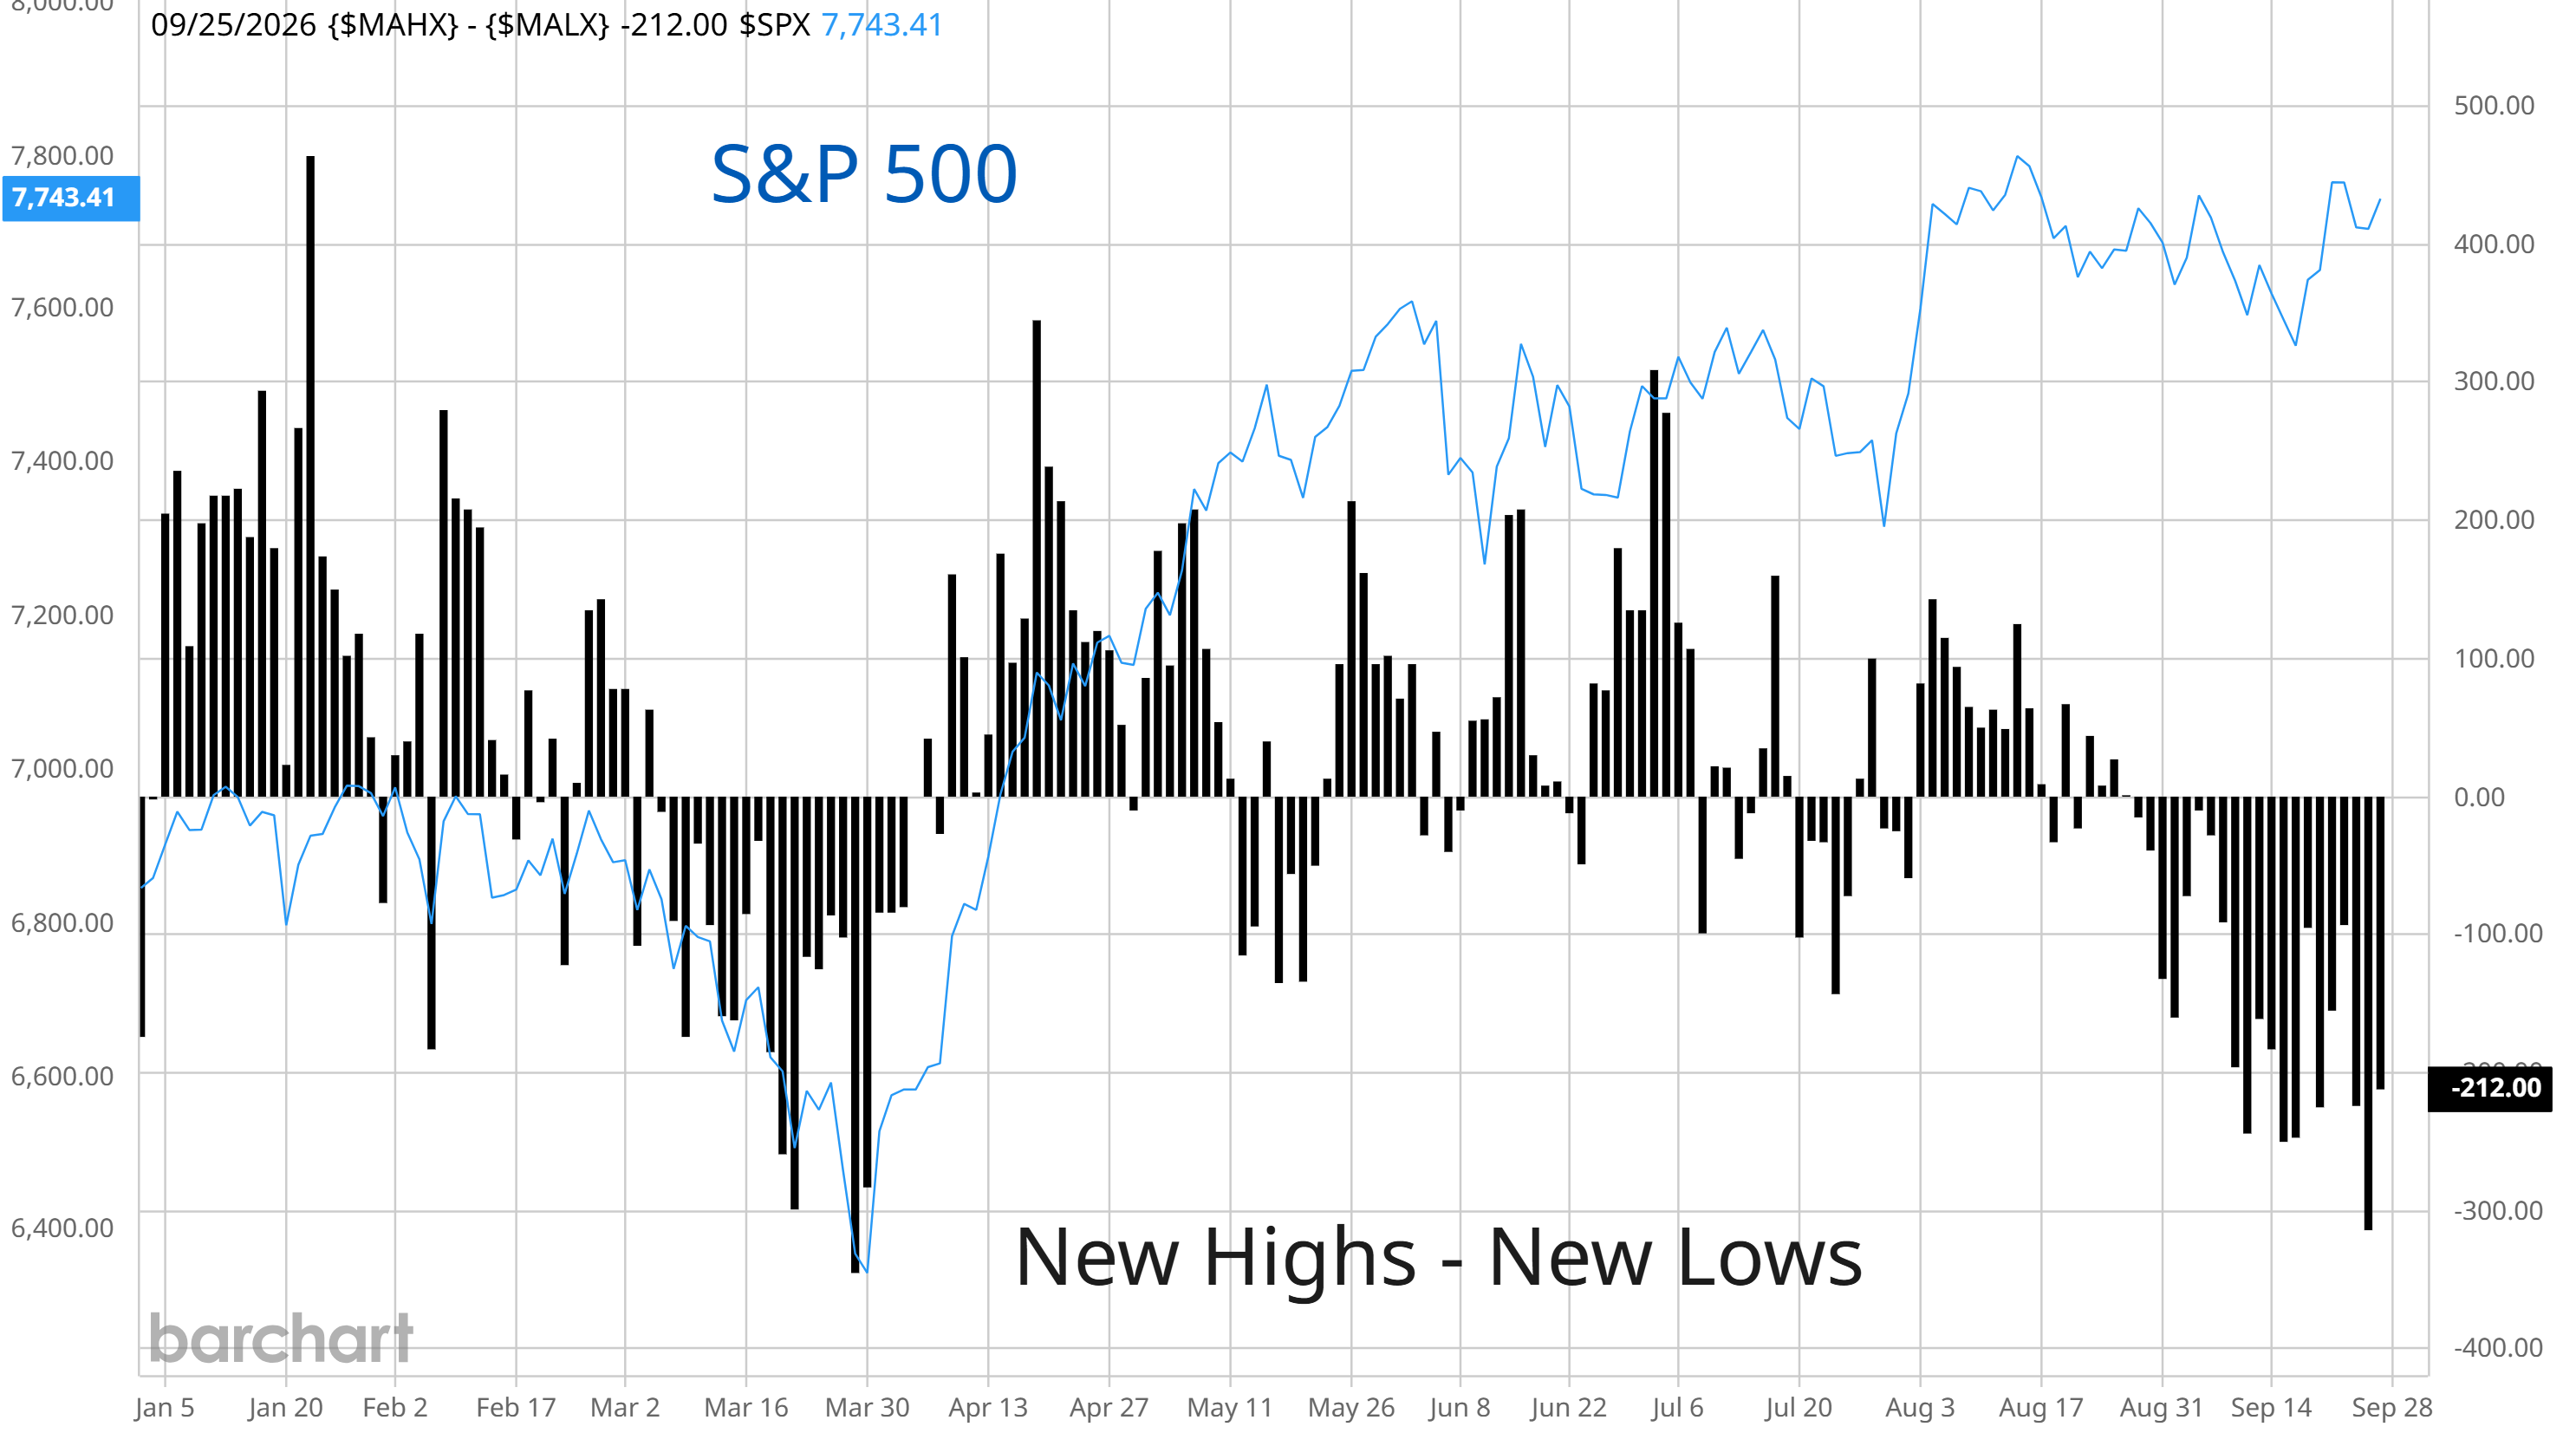
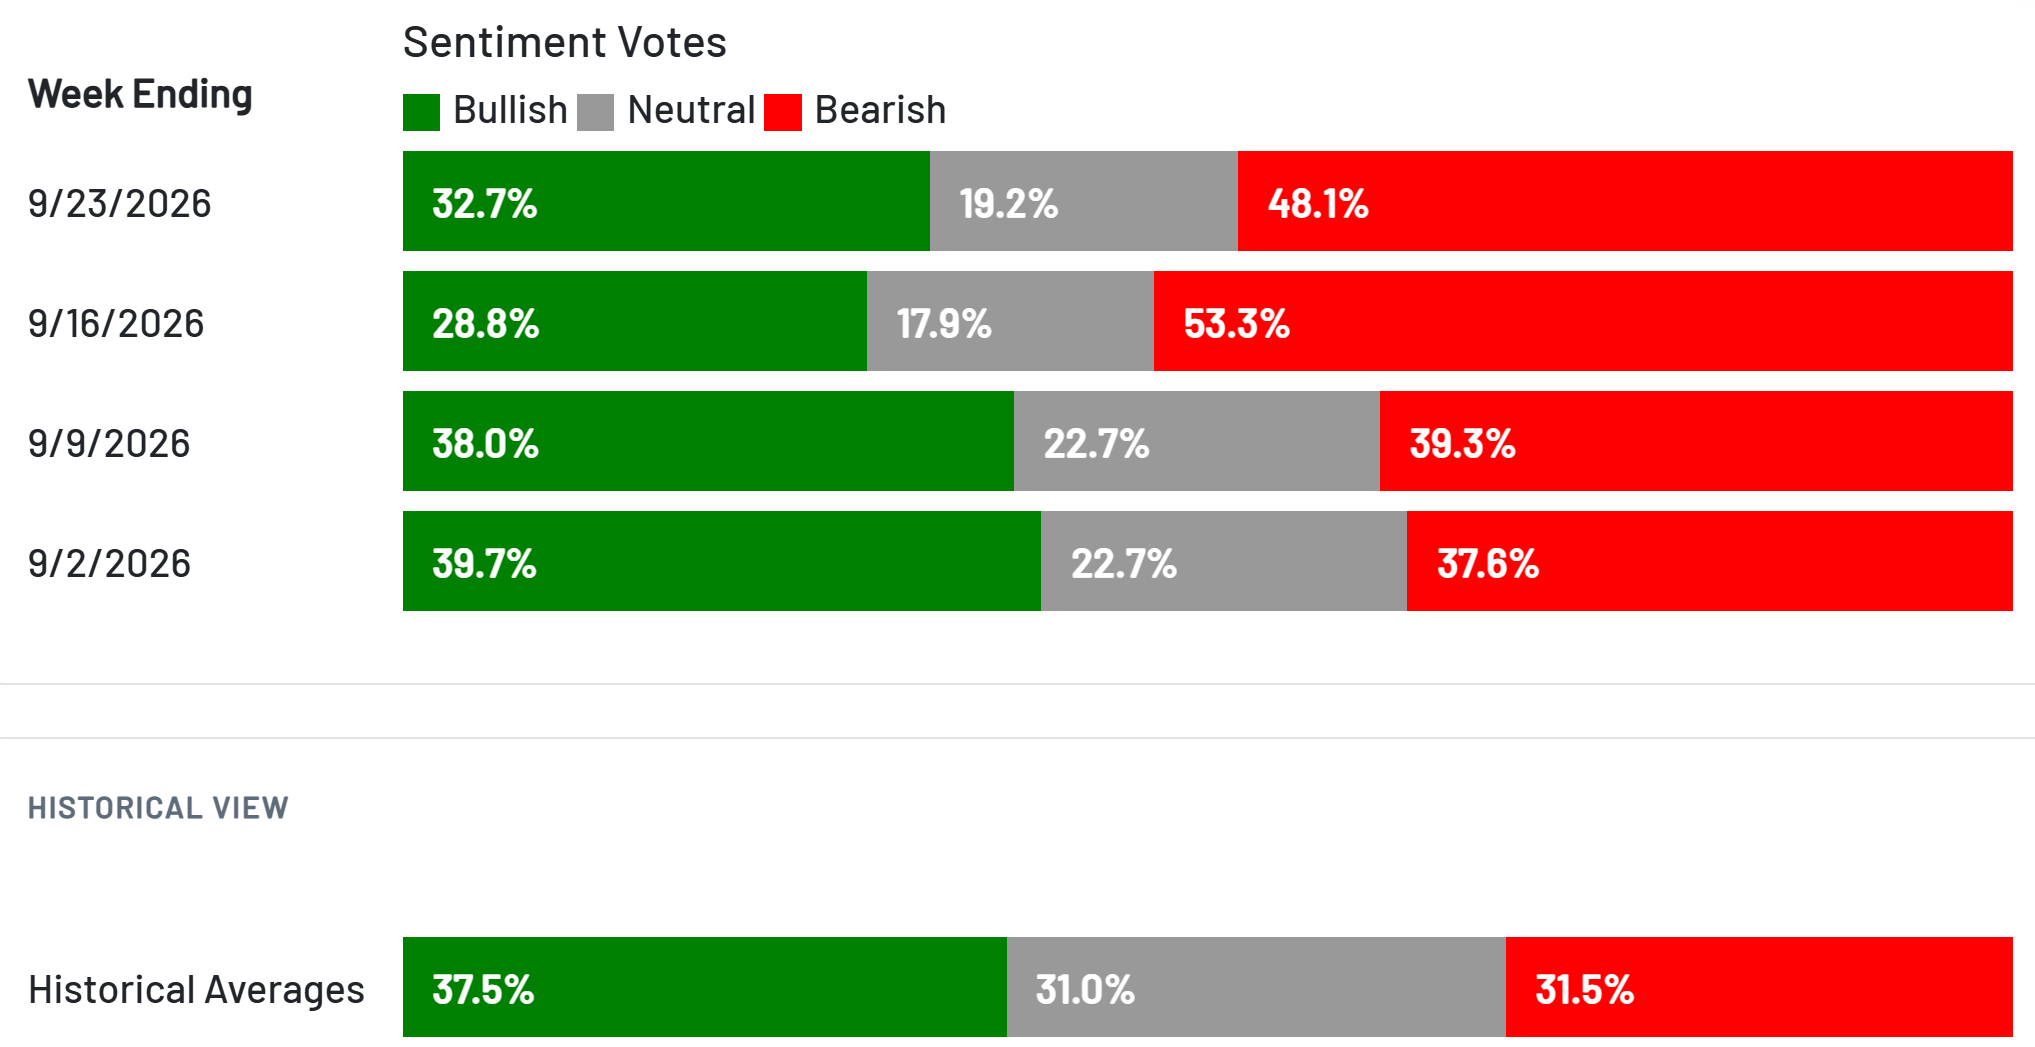
While market breadth is deteriorating sharply since mid-August, an extremely oversold breadth condition is forming. On a year-to-date basis, the percent of stocks trading in short-term uptrends has only been this low back in late March when the S&P fell near correction territory. Many other measures of breadth show the presence of an oversold condition while investor sentiment has seen a large jump in bearish views over the past two weeks. The AAII sentiment survey of retail investors showed bearish views at 53.3% last week and 48.1% this week, which is well above the historical average of 31.5% and outnumbers bullish views (chart below). CNN’s Fear & Greed Index also remains firmly in “fear” territory.
While interest rate volatility and hawkish shift at the Federal Reserve is playing a role in pressuring the average stock, evidence doesn’t yet point to a deteriorating economy. That supports the corporate earnings outlook, which means the combination of oversold breadth and negative investor sentiment could help spark a rally.
Keep reading to see:
Open ETF positions.
Open stock positions.
Chart analysis for new trade ideas.
