

In this post, I’ll focus on setups that I’m monitoring for both long and short positions. With a chart and short write-up, this is a quick way to scan and plan potential trades.
These ideas are the end result of my process to identify stocks offering the right combination of growth fundamentals along with a proper chart setup.
Stock Market Update
While the Federal Reserve cut interest rates by 0.25% for the third consecutive time, the meeting featured something for doves and hawks alike. As expected heading into the event, divisions within the Fed on the forward path of rates were on full display. There were three dissenting votes, with one official preferring a larger cut while two members wanted to keep rates steady. That’s the largest number of dissenting votes since 2019. The meeting statement also added the language “considering the extent and timing of additional adjustments”, which is the same comments used last December before the Fed’s pause in rate cuts.
Fed Chair Jerome Powell also sought to temper expectations by stating that the fed funds rate is now “within a broad range of estimates of its neutral value.” The Fed’s Summary of Economic Projections shows just one quarter-point cut expected for all of 2026 compared to market-implied odds for two cuts. But in a bullish development, the Fed also announced that it will begin purchasing $40 billion in Treasury bills on a monthly basis. Although the central bank won’t call it quantitative easing, the move is intended to address liquidity concerns in money markets and will expand the Fed’s balance sheet, which follows the end to quantitative tightening earlier this month.
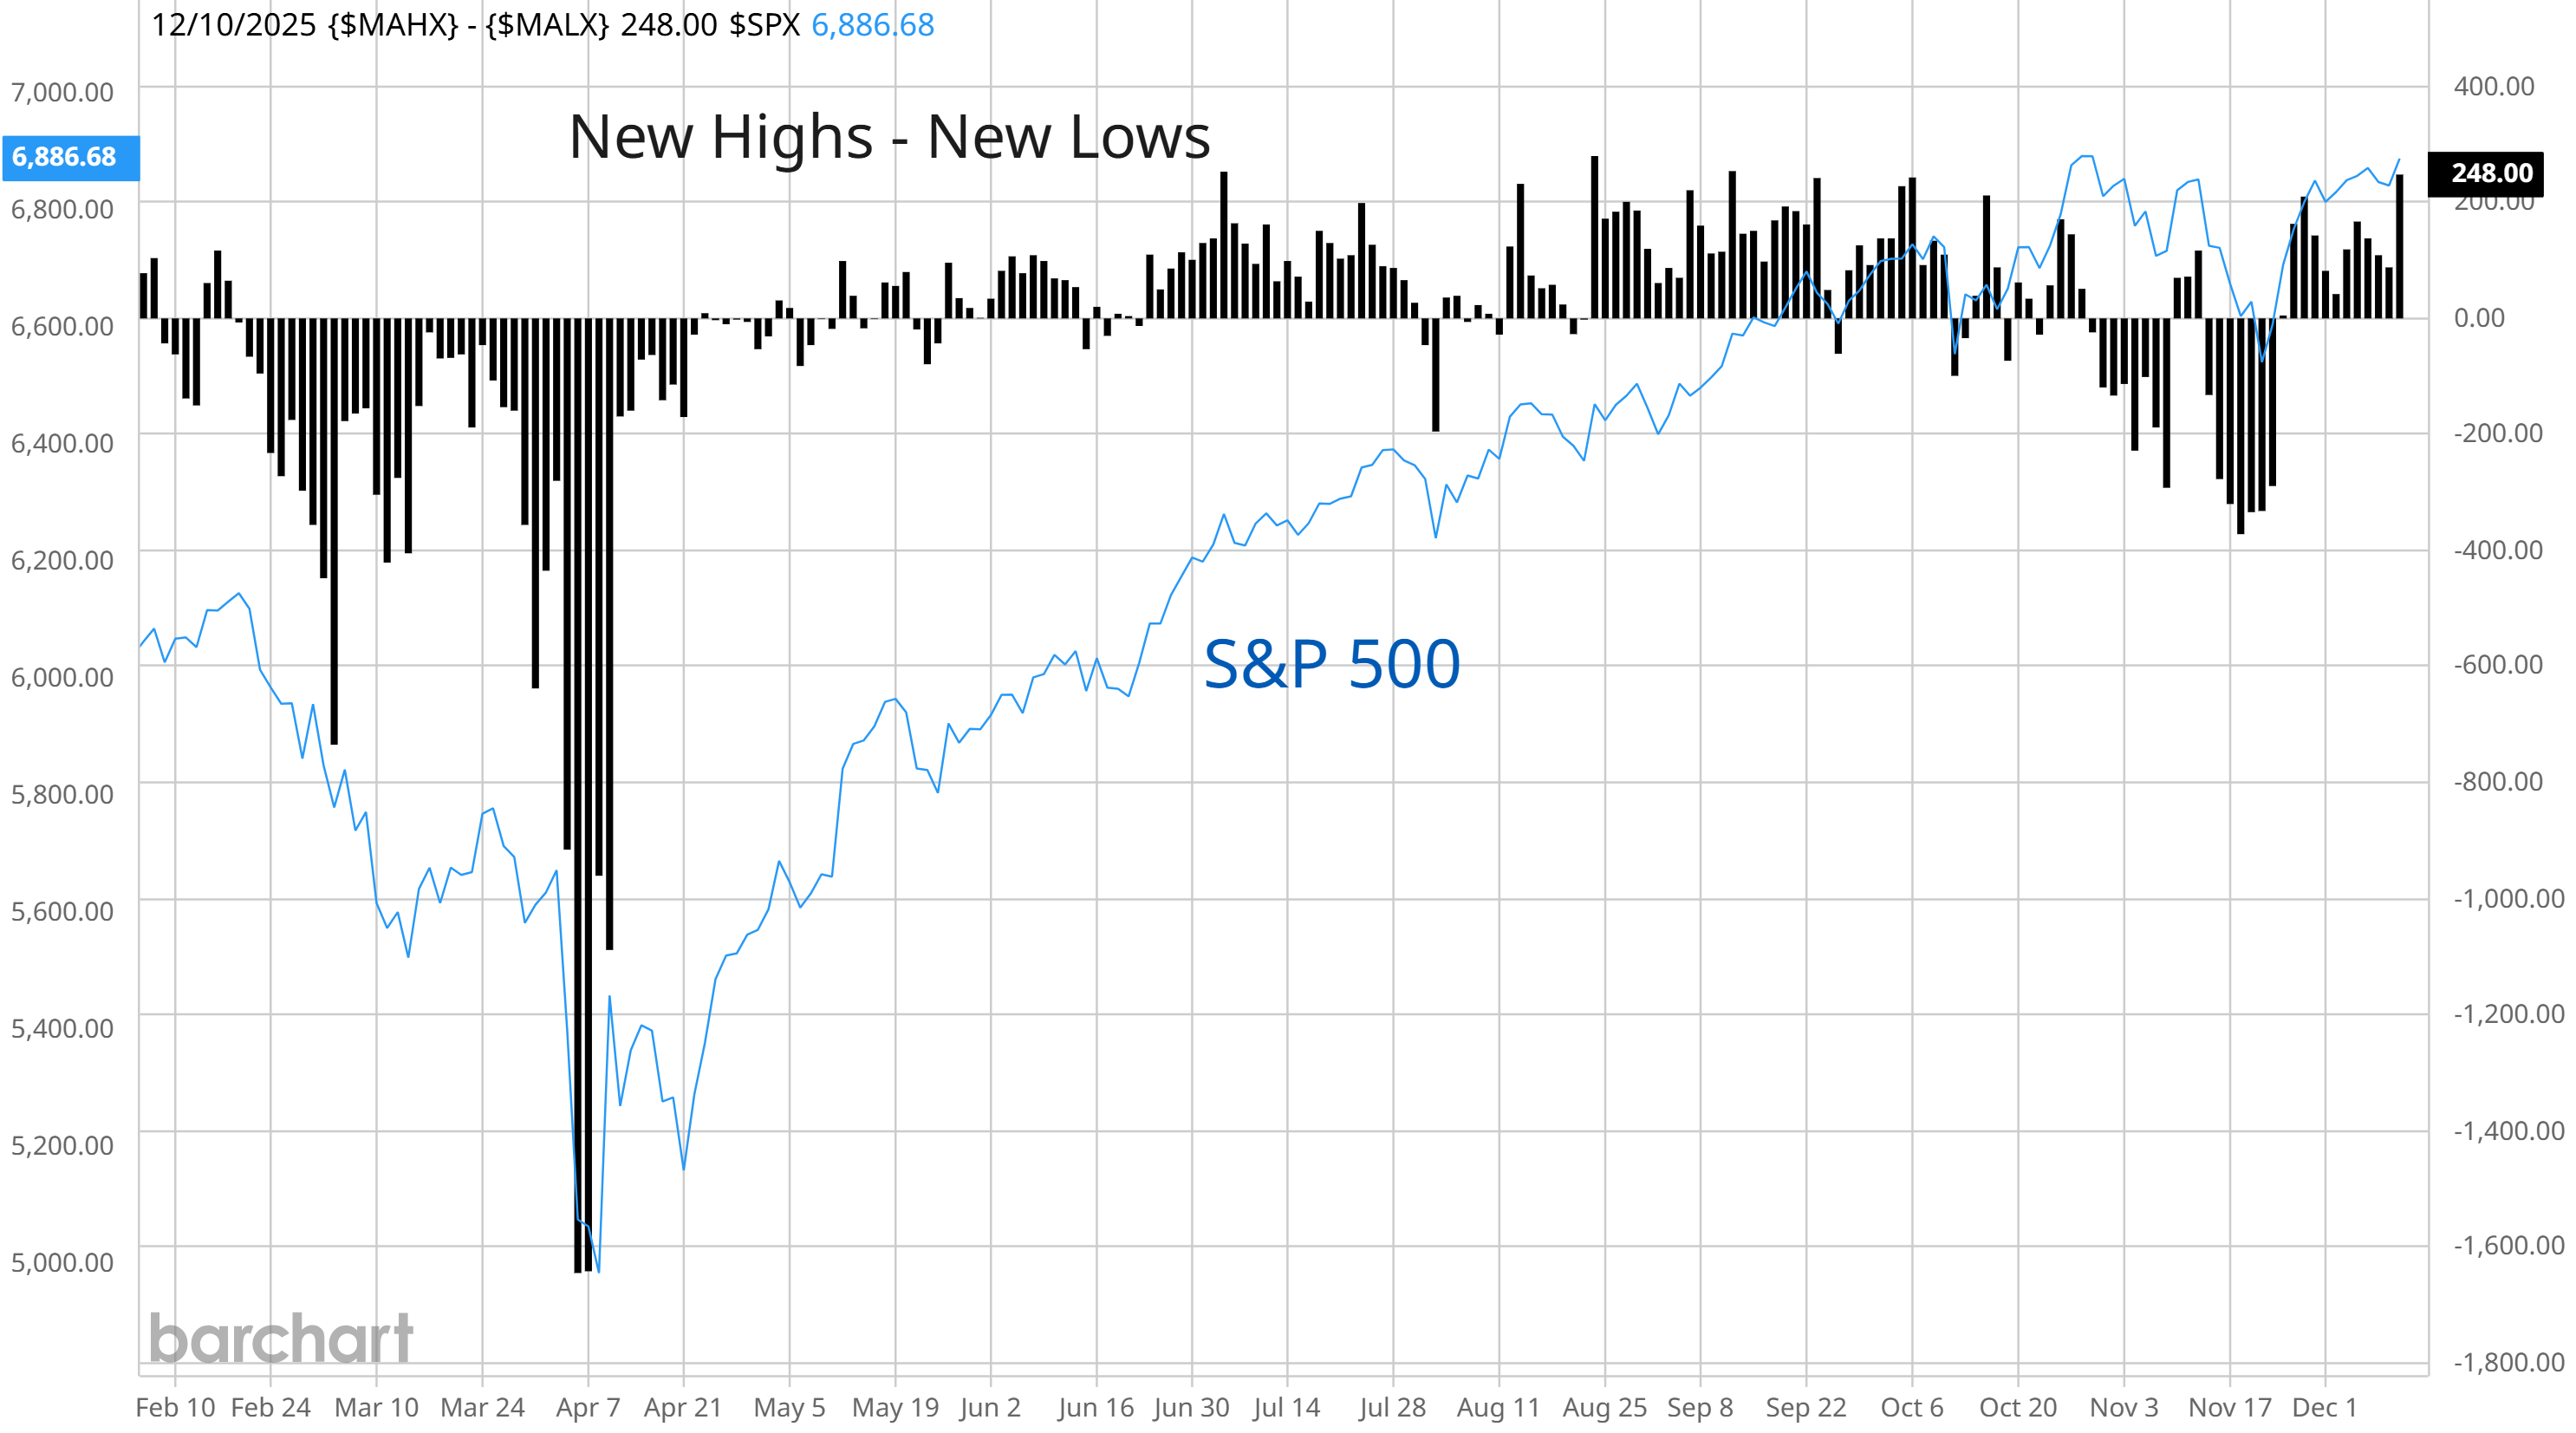
The reaction across the capital markets focused on the more dovish aspects of the meeting to boost financial market liquidity, with stocks rallying while a selloff in the U.S. dollar delivered a boost to precious metals. The action in small- and mid-caps was especially strong, which follows a period of strong breadth heading into Thanksgiving week. The broadening rally helped drive a spike in net new 52-week highs in the chart below, which takes the difference between new 52-week highs and new lows. Net new highs topped one of the highest levels seen this year following the reaction to the Fed.
We’re continuing to trail several open positions across precious metals and miners, along with stocks leveraged to the AI-driven data center buildout. Several new chart setups are evolving favorably with the market action, and are close to completing their breakouts. Keep reading to see:
Open ETF positions.
Open stock positions.
Chart analysis for new trade ideas.
