Welcome back to Mosaic Chart Alerts!
In this post, I’ll focus on setups that I’m monitoring for both long and short positions. With a chart and short write-up, this is a quick way to scan and plan potential trades.
These ideas are the end result of my process to identify stocks offering the right combination of fundamentals along with a proper chart setup.
Here are my notes from a focus list of setups I’m monitoring.
Stock Market Update
While the Federal Reserve hiked short-term rates by another 0.25% as expected, it’s what they didn’t say that has investors excited. The meeting statement removed the “some additional policy firming” language that was seen in prior meetings. That means a pause is in the works, which shouldn’t come as a surprise. That’s because the bond market has been clearly signaling that this rate hiking cycle is over. You can see that in the chart below of the effective federal funds rate (blue line) compared to the 2-year Treasury yield (red line). The 2-year Treasury tends to lead the way with fed funds, as evident by the last three hiking cycles. And with the 2-year yield again crossing below fed funds a couple months ago, the writing was on the wall.
And while you might think an end to this hiking campaign would be a good thing for stocks, I’m not getting overly bullish until participation in the market’s trend improves. The fact is that breadth remains poor in this market. I’ve highlighted over the past several weeks that stocks trading in short- and intermediate-term uptrends are severely lagging the action in the S&P 500, while small-caps are on the brink of testing their bear market lows as I posted about here.
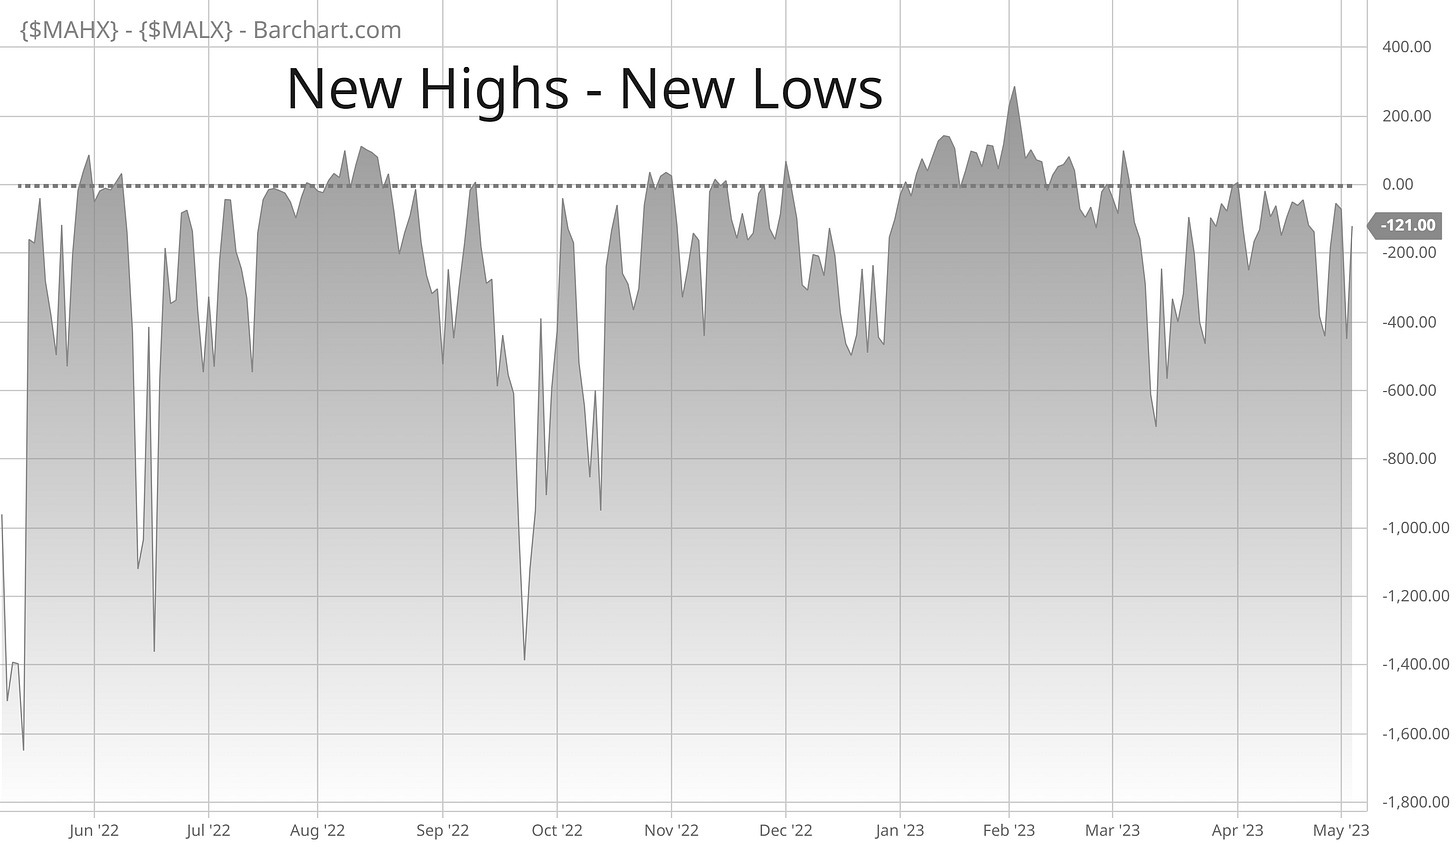
There needs to be an all-clear signal for better action coming out of the stock market, and tracking net new highs is one way to verify. This metric simply takes stocks making new 52-week highs and subtracts new 52-week lows. Being above or below zero is quite revealing of the market’s overall health. In my opinion, early January was one of the best periods in over a year for trading breakouts. And I don’t think it’s a coincidence that net new highs moved into positive readings (above the dashed line) at the same time. But since early March, we’ve been stuck in negative territory. A move back to positive net new highs would show constructive action under the stock market’s hood.
Similar to the past several weeks, I’m still holding a large cash position but taking breakouts that meet my criteria. I simply handle risk in this market by scaling back my position sizing. Both LTH and SFM have moved above resistance in their chart setups, so I’m removing those stocks from the watchlist. On the short side, UPWK is breaking down through support to complete its pattern so it comes off watch. I’m also removing GNRC as a post-earnings gain in the stock invalidates the setup. That means there’s room for new additions to the list this week.
***And be aware of earnings dates***
Keep reading below for all the updates…
Long Trade Setups
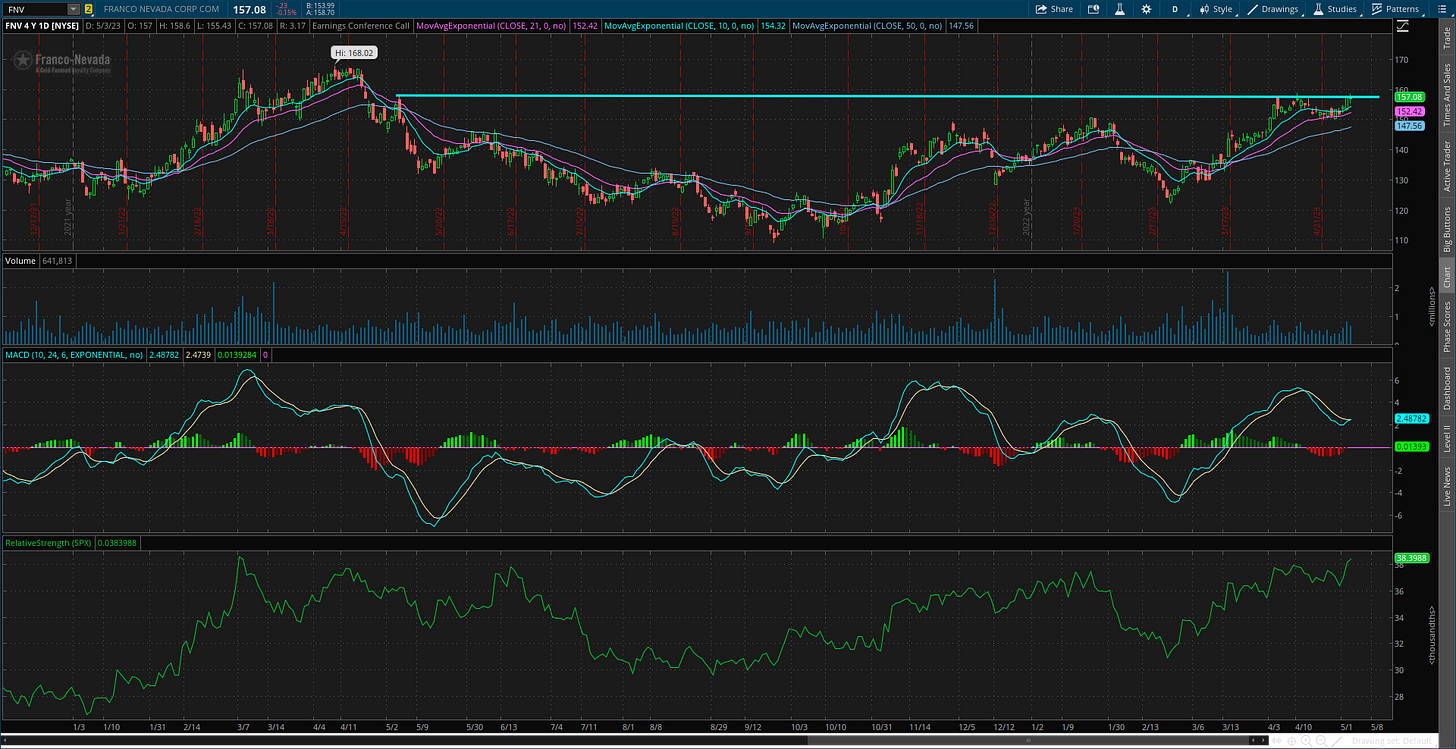
FNV
Gold mining royalty stock testing resistance just below the $160 level. Follows a MACD reset at the zero line and relative strength (RS) line near 52-week highs. Pattern since mid-April similar to a bull flag that’s breaking out.
SOVO
Shorter-term pattern compared to my typical setup, but also breaking out of a bull flag going back to last month. Taking out the prior high around $17.80 in today’s trading, with RS line making a new high on this move.
NVGS
Trading in a consolidation pattern since last June, creating an ascending triangle. Don’t like the recent move below key moving averages, but will keep on watch for a breakout over the $15 level since it’s still within the pattern.
PODD
On the verge of taking out resistance going back to the 2021 peak around the $325 level. Looking for an increase in volume and RS line to new highs on a breakout.
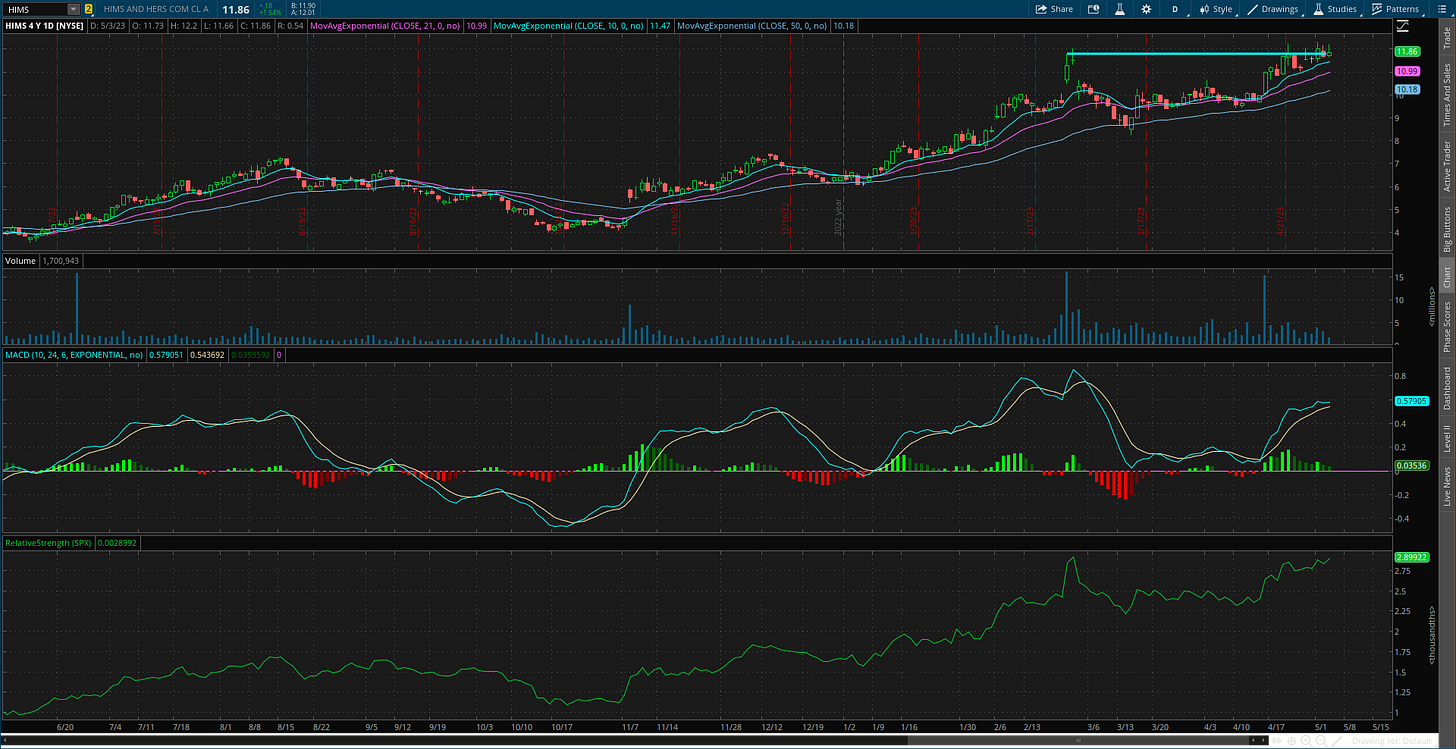
HIMS
Shorter-term basing pattern compared to what I usually target, but also emerging from a bottoming process. Still looking for a close over the $12 level, but the MACD is becoming too extended.
SKY
Recently failed on a breakout attempt over $73. A jump in volume along with RS at new highs were positive signs, but price fell back into the pattern. Keeping on watch, with $75 now being the breakout level.
Short Trade Setups
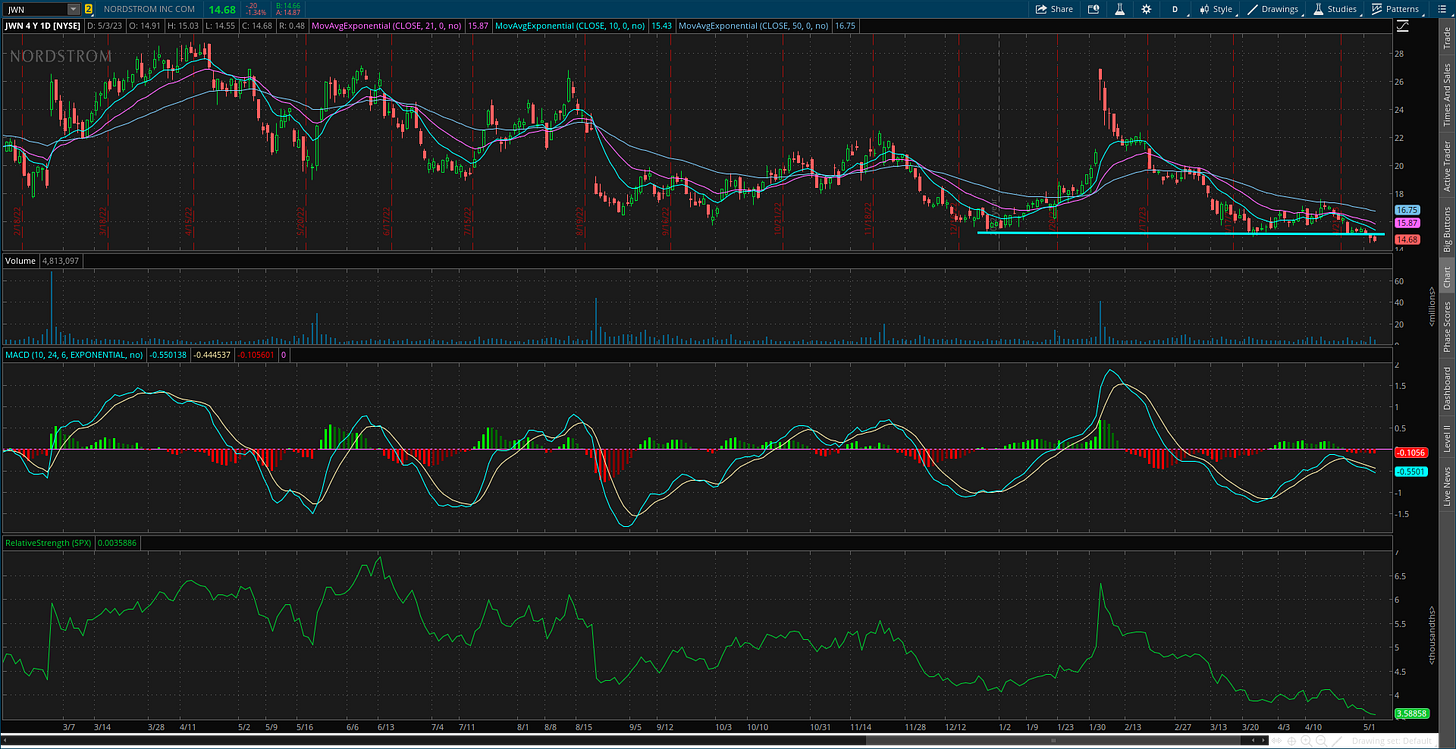
JWN
Creating a support level around the $15 level since the start of the year. Last two trading sessions starting to take out that level following a MACD reset under zero.
CHPT
Testing support just above the $8 level while the RS line remains near all time lows. Looking for a downside continuation move with a break of support.
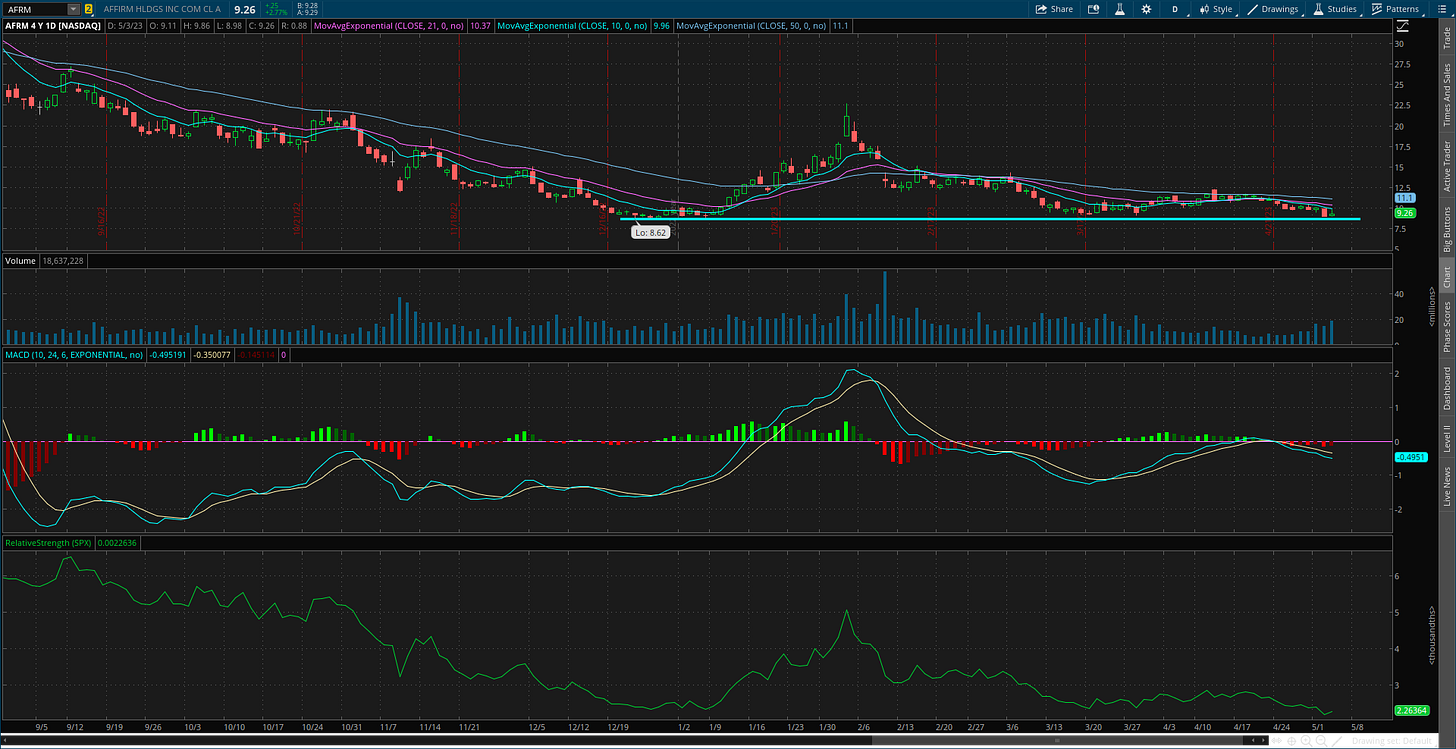
AFRM
Still hanging around the December lows with a MACD negative crossover signal from the zero line. Looking for price to close under the $8.50 level.
Rules of the Game
I trade chart breakouts based on the daily chart for long positions. And for price triggers on long setups, I tend to wait until the last half hour of trading to add a position. I find that emotional money trades the open, and smart money trades the close. If it looks like a stock is breaking out, I don’t want a “head fake” in the morning followed by a pullback later in the day.
I also use the RS line as a breakout filter. I find this improves the quality of the price signal and helps prevent false breakouts. So if price is moving out of a chart pattern, I want to see the RS line (the green line in the bottom panel of my charts) at new 52-week highs. Conversely, I prefer an RS line making new 52-week lows for short setups.
Also for long positions, I use the 21-day exponential moving average (EMA) as a stop. If in the last half hour of trading it looks like a position will close under the 21-day EMA, I’m usually selling whether it’s to take a loss or book a profit.
For short (or put) positions, I trade off a four-hour chart instead of a daily. Why? There’s a saying that stocks go up on an escalator and down on an elevator. Once a profitable trade starts to become oversold on the four-hour MACD, I start to take gains. Nothing like a short-covering rally to see your gains evaporate quickly, so I’m more proactive taking profits on short positions. I also use a 21-period EMA on the four-hour chart as a stop. If there is a close above the 21-period EMA, I tend to cover my short.
For updated charts, market analysis, and other trade ideas, give me a follow on Twitter: @mosaicassetco
Disclaimer: these are not recommendations and just my thoughts and opinions…do your own due diligence! I may hold a position in the securities mentioned in this post.


