Welcome back to Mosaic Chart Alerts!
In this newsletter, I’ll focus on the best setups that I’m monitoring for both long and short positions. With a chart and short write-up, this is a quick way to scan and plan potential trades.
These ideas are the end result of my process to identify stocks offering the right combination of fundamentals along with a proper chart setup.
Here are my notes from a focus list of setups I’m monitoring.
Stock Market Update
February certainly lived up to its reputation for poor seasonality, with the S&P 500 dropping 5% from its high at the start of the month. The good news is that the calendar gets more favorable over the next couple of months, with March and April among the best for returns going back to 1950 as I highlighted in last week’s Market Mosaic. I also posted a more detailed chart on how the calendar tends to play out below.
Of course, I would never make a trading decision based solely on historic seasonal movements. But I like to be aware when a trend reversal is possible, and now could be one of those times. That’s because of several signs the stock market is getting oversold while excessive bullish sentiment is finally clearing. If we do see upside, I want to confirm a positive trend with the performance of cyclical sectors. These areas of the market were leading the way back in January, which was a bullish risk-on signal.
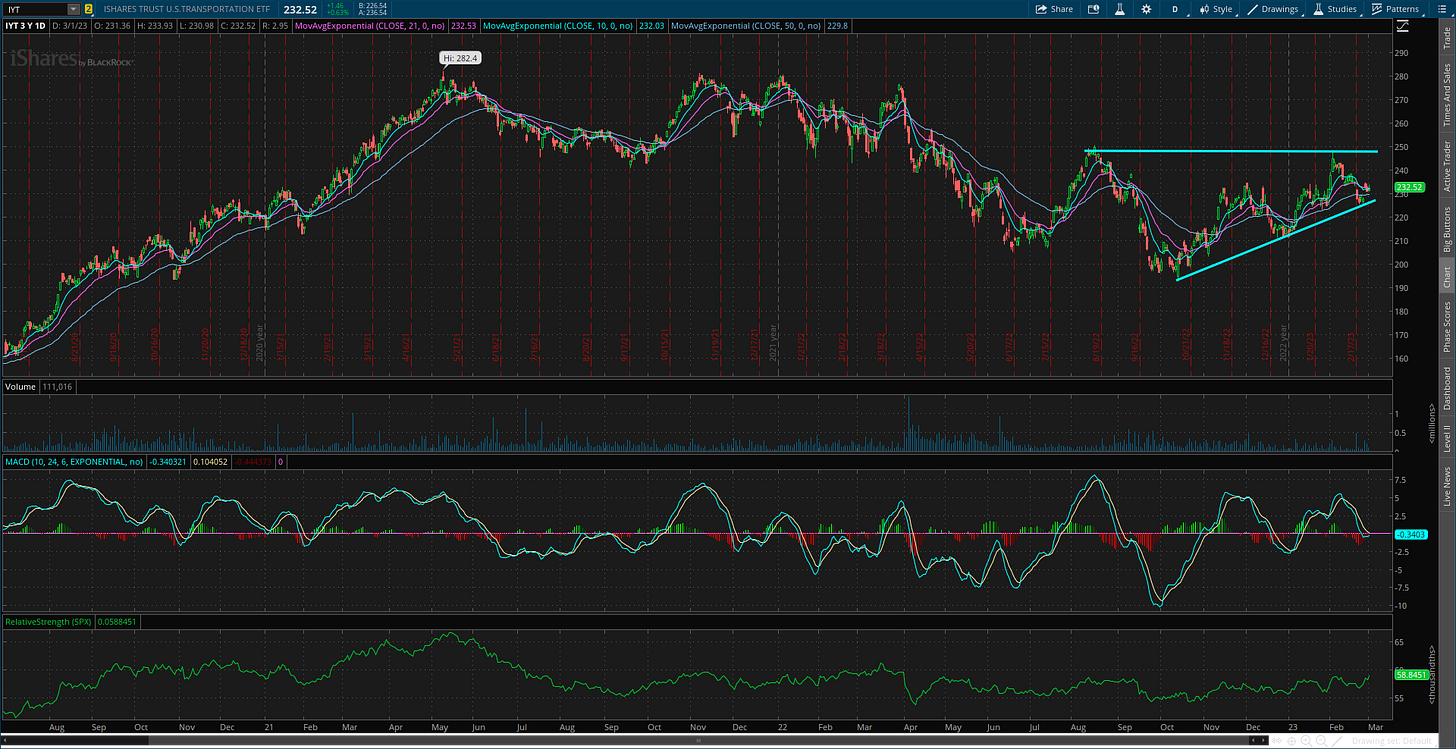
Those economically-sensitive sectors include transportation stocks, semiconductor companies, and small-caps. And each one has a similar chart setup, which I’ll highlight with the IYT transportation sector ETF below. After a hot start to the year, IYT has been consolidating gains over the past month. But that’s allowed IYT to reset the MACD at the zero line, while trendline support and key moving averages are being tested. IYT has traded higher over the last several sessions, and ideally momentum would lead to a breakout over resistance from the August peak. A similar pattern is taking shape with small-caps and semiconductors, where a breakout across these sectors would be a big positive for the market environment.
There are several updates to the watchlist this week. The broader pullback over the past month is invalidating a couple long setups on watch, including BE and APH. Neither stock broke out from its chart pattern and are now trading below key moving averages. But WHR on the short watchlist has completed its pattern by moving below support, so that stocks comes off the list as well. I’m also removing MOS from the short watchlist, which never triggered and is showing more relative strength this past week. That means there are additions to both lists.
Keep reading below for all the updates…
Long Trade Setups
SEDG
Putting this stock back on watch after a brief delisting! Watching a similar trendline level as before, with resistance now around the $345 area. Looking for additional confirmation with a move above the prior highs around $370.
GEF
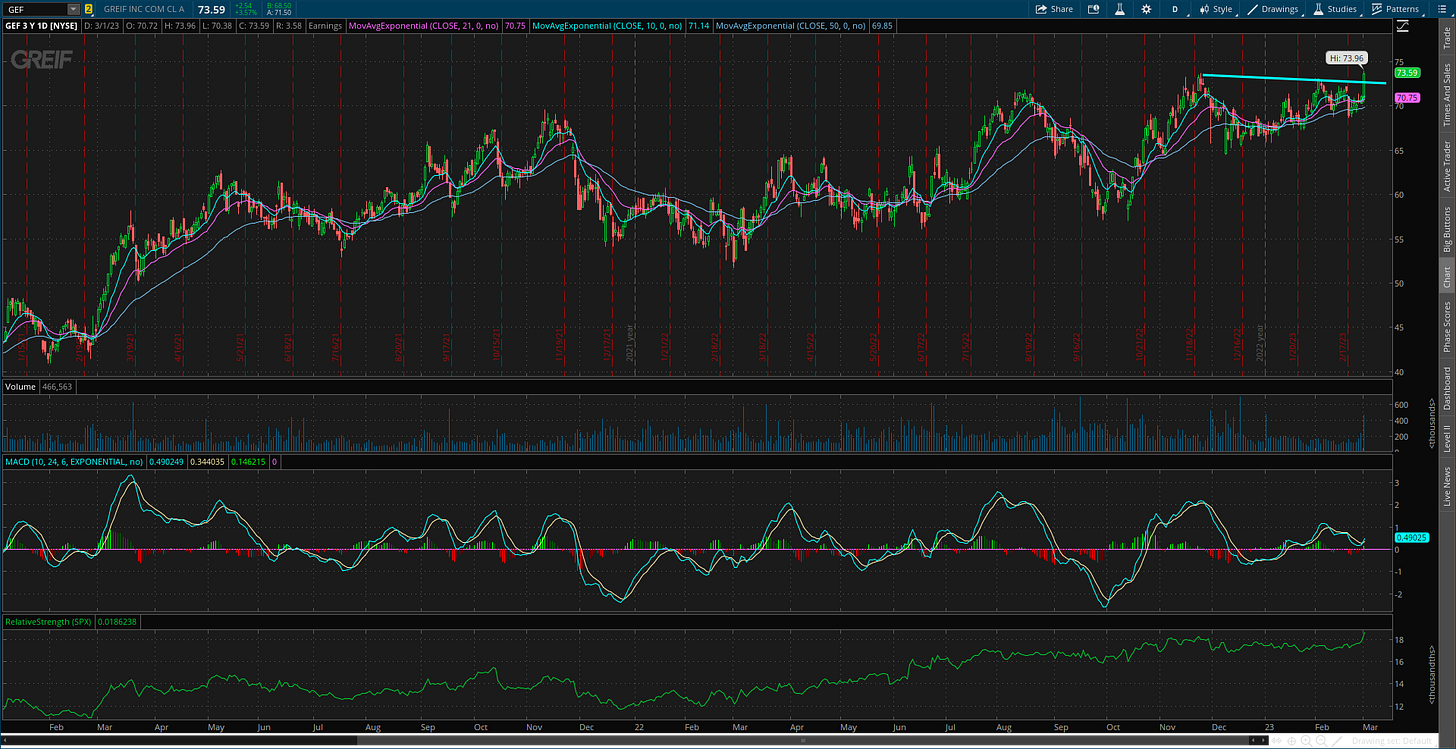
Breaking out following earnings today. The MACD had just reset at the zero line, while today’s move came on increasing volume and the relative strength (RS) line moved out to new highs.
GFS
Recent IPO that tried to break above $70 resistance and failed. The pullback is resetting the MACD at the zero line while the RS line is hovering near the highs. Looking for another attempt at $70 that can test the prior high at $80.
HOG
Earnings gap tried to breakout then failed. Pullback has filled the gap and reset the MACD. Looking for another attempt to move over the $50 level.
OC
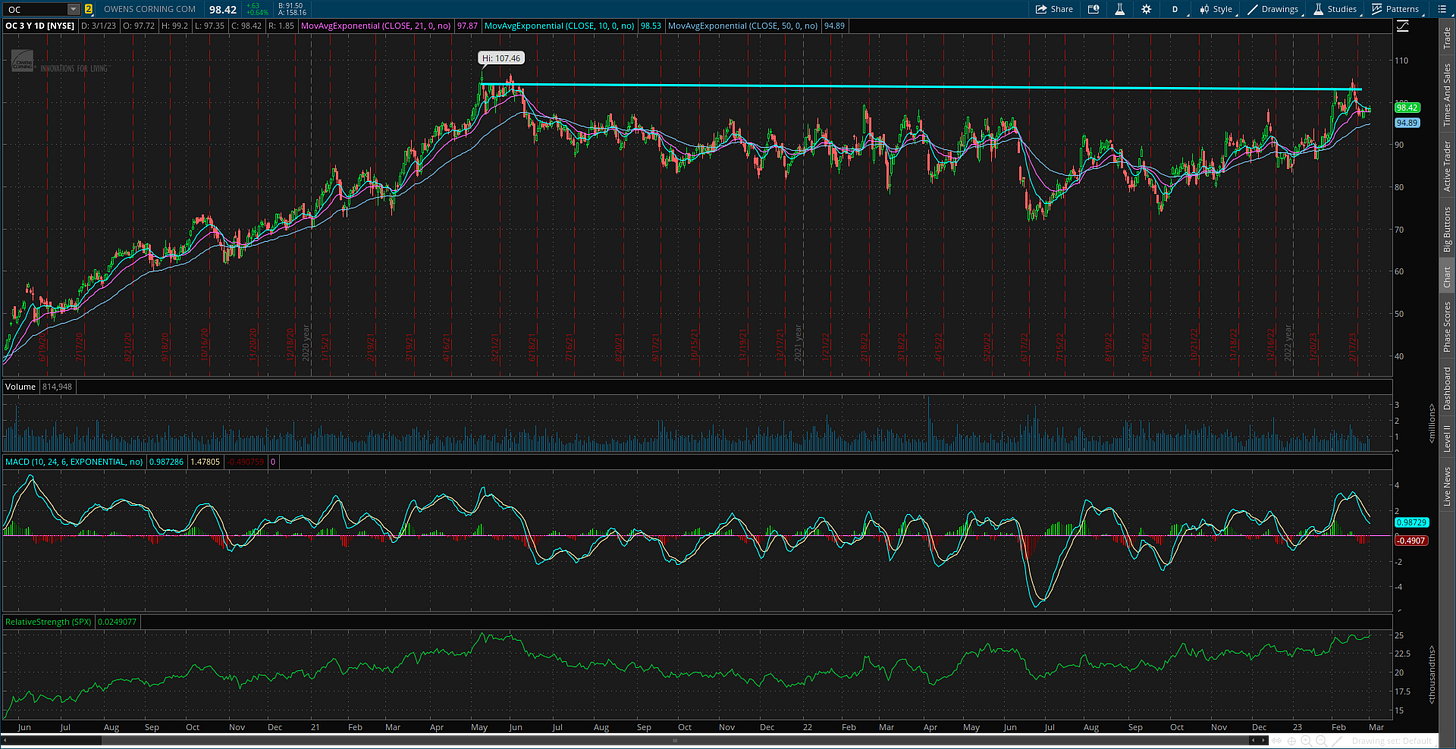
Building products stock that ran up to the prior resistance highs around $105. Expect the recent pullback to set up another breakout attempt. Also notable that the RS line is staying close to new highs.
AVNW
Massive consolidation pattern in the works for nearly two years. Rallying off support at the $35 level which is also the gap higher. Seeing the MACD reset closer to zero before trying to breakout over the $40 level.
Short Trade Setups
MKC
Testing trendline support at the $73 level, which also follows a MACD reset under the zero line. Expect a breakdown to first target $70, with not much other support below that level.
TSN
Testing support at the $59 area, which is an important level going back to 2021. Both the MACD and RS line in a position to support a breakdown.
SPWR
Targeting a move below the $15 support level, which was tested again this week. MACD and RS line still in position to support a move lower.
RUN
Creating a bearish triangle continuation pattern. Tested trendline support this week around the $23 level, where I’m watching for a close below.
Rules of the Game
If you haven’t noticed yet, I trade breakouts! I trade based on the daily chart for long positions. And for price triggers on long setups, I tend to wait until the last half hour of trading to add a position. I find that emotional money trades the open, and smart money trades the close. If it looks like a stock is breaking out, I don’t want a “head fake” in the morning followed by a pullback later in the day.
New Filter: After extensive back testing and live implementation, I am adding new highs on the RS line as a breakout filter. I find this improves the quality of the price signal and helps prevent false breakouts. So if price is moving out of a chart pattern, I want to see the RS line (the green line in the bottom panel of my charts) at new 52-week highs. Conversely, I prefer an RS line making new 52-week lows for short setups.
Also for long positions, I use the 21-day exponential moving average (EMA) as a stop. If in the last half hour of trading it looks like a position will close under the 21-day EMA, I’m usually selling whether it’s to take a loss or book a profit.
For short (or put) positions, I trade off a four-hour chart instead of a daily. Why? There’s a saying that stocks go up on an escalator and down on an elevator. Once a profitable trade starts to become oversold on the four-hour MACD, I start to take gains. Nothing like a short-covering rally to see your gains evaporate quickly, so I’m more proactive taking profits on short positions. I also use a 21-period EMA on the four-hour chart as a stop. If there is a close above the 21-period EMA, I tend to cover my short.
For updated charts, market analysis, and other trade ideas, give me a follow on Twitter: @mosaicassetco
Disclaimer: these are not recommendations and just my thoughts and opinions…do your own due diligence! I may hold a position in the securities mentioned in this newsletter.


