

In this post, I’ll focus on setups that I’m monitoring for both long and short positions. With a chart and short write-up, this is a quick way to scan and plan potential trades.
These ideas are the end result of my process to identify stocks offering the right combination of growth fundamentals along with a proper chart setup.
Stock Market Update
The stock market initially shrugged off the Moody’s debt downgrade. The agency downgraded the U.S. credit rating by one notch this past weekend, stripping away its top level. S&P and Fitch had already done the same years ago. The S&P 500 reacted with its sixth daily consecutive gain to start the week. But a poor bond auction on Wednesday is sending longer-dated yields surging higher. You can see in the chart below that the 30-year Treasury yield went to 5.08%. That’s completing an ascending triangle pattern shown with the trend lines. A move out of the pattern could send the 30-year rate to the highest level since 2007.

Higher rates can negatively be a negative catalyst for stock prices in a number of ways. Higher borrowing costs impacts consumer spending and the ability of corporations to fund new projects. Both effects can call the corporate earnings outlook into question. Higher interest rates also makes future corporate profits worth less in today’s terms, which impacts valuations. The current state of above average valuations makes them even more susceptible to rising rates. Finally, a jump in interest rates presents competition for investor capital since bonds offer a more attractive return than before.
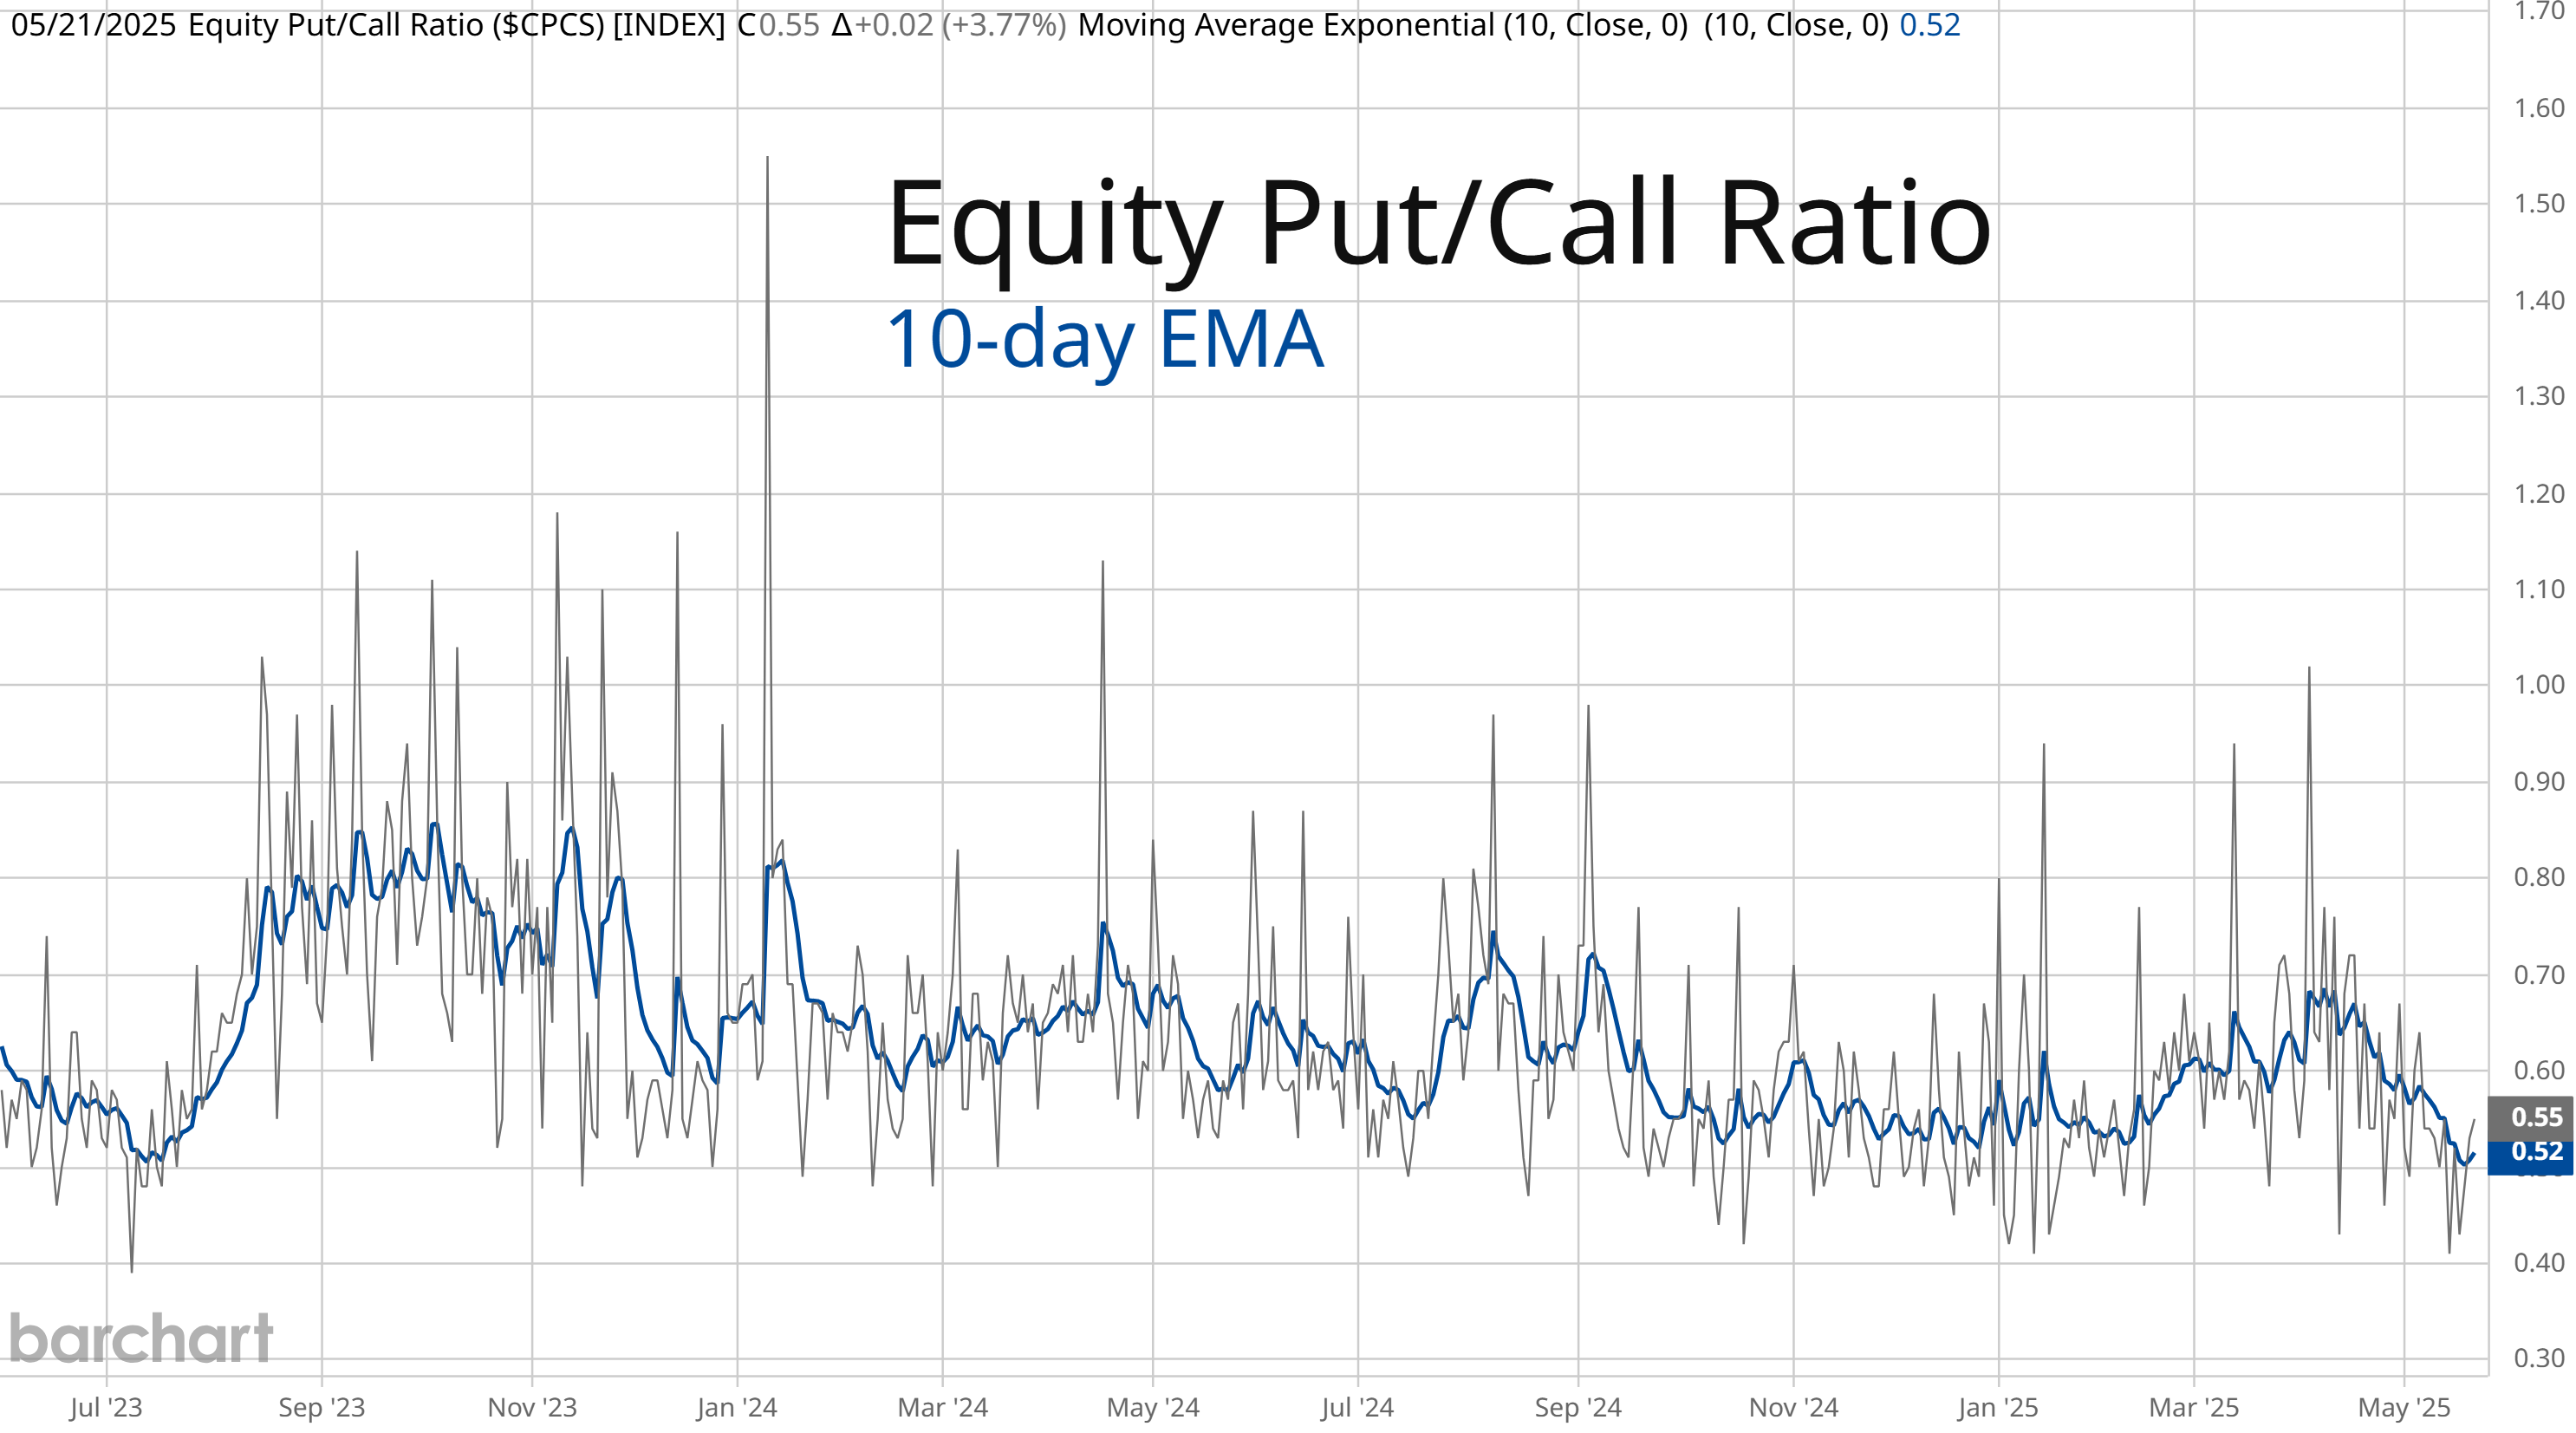
While the Moody’s downgrade and jump in rates could be the catalyst for a pullback, conditions had already turned bearish recently. That includes excessive bullish investor sentiment and deteriorating breadth where the average stock is starting to lag the rally in the S&P 500. Some signs of investor positioning also point to elevated bullish moods. The 10-day moving average of the equity put/call ratio dropped to the lowest level since July 2023 (blue line in the chart below). Back then, it marked the start of a 10% correction the S&P 500.
If a pullback does develop, it would go a long way toward completing many chart setups on our watchlist that could use one more smaller pullback. I believe a broader market drop over the next month could actually lead to one of the best breakout trading environments that you’re likely to see this year. Keep reading to see:
Open ETF positions.
Open stock positions.
Chart analysis for new trade ideas.
