Mosaic Chart Alerts
Falling yields boost stocks, but low-quality leading the way. Several updates to the watchlist.
Welcome back to Mosaic Chart Alerts!
In this newsletter, I’ll focus on the best setups that I’m monitoring for both long and short positions. With a chart and short write-up, this is a quick way to scan and plan potential trade ideas.
And to select these ideas, a lot of work goes on behind the scenes to find stocks offering the right combination of fundamental attributes along with a proper chart setup.
These are my notes from a shortlist of setups I’m monitoring.
Weekly Recap
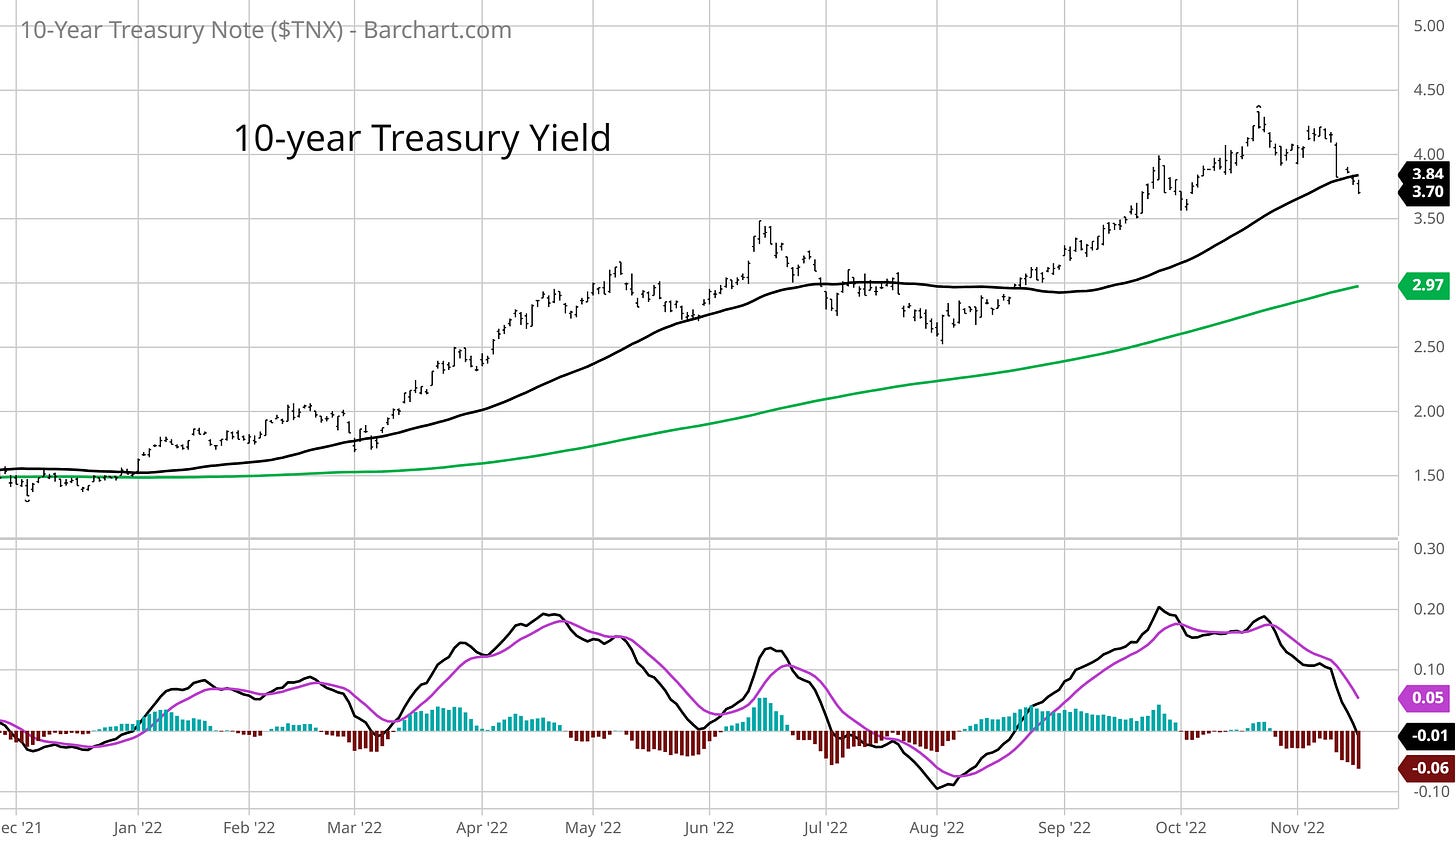
Over the past week, separate reports covering consumer and producer price inflation both rose less than expected for the month of October compared to year-ago levels. I noted the potential for the Consumer Price Index in particular to deliver a surprise that could reverse prevailing trends in the market. And that happened in a big way, especially with stocks in the speculative growth space that have seen massive rallies over the past week. Those rallies have also been boosted by a pullback in the 10-year Treasury yield (chart below), which is now breaking below the 50-day moving average after hitting 4.25% last month.
But in my opinion, the action unfolding over the past week bears all the hallmarks of a short-covering rally where beaten up shares of low-quality stocks lead the way. Signs of strong institutional participation have been absent, and in many cases growth stocks that broke key support levels are now testing those break down points as resistance like with Tesla (chart below). Along with widespread overbought conditions, I’m being cautious by actively taking profits on long setups that have been working while waiting patiently for new setups to trigger.
For this week, I have several updates to the watchlist following the volatility. I’m removing several long setups that I’ve recently highlighted and are holding their chart breakouts, including VPG, AMAL, and AMOT. Among short setups, I’m removing SE and FVRR where recent rallies have invalidated their setups. New ideas are joining both lists…keep reading for updates.
Long Trade Setups
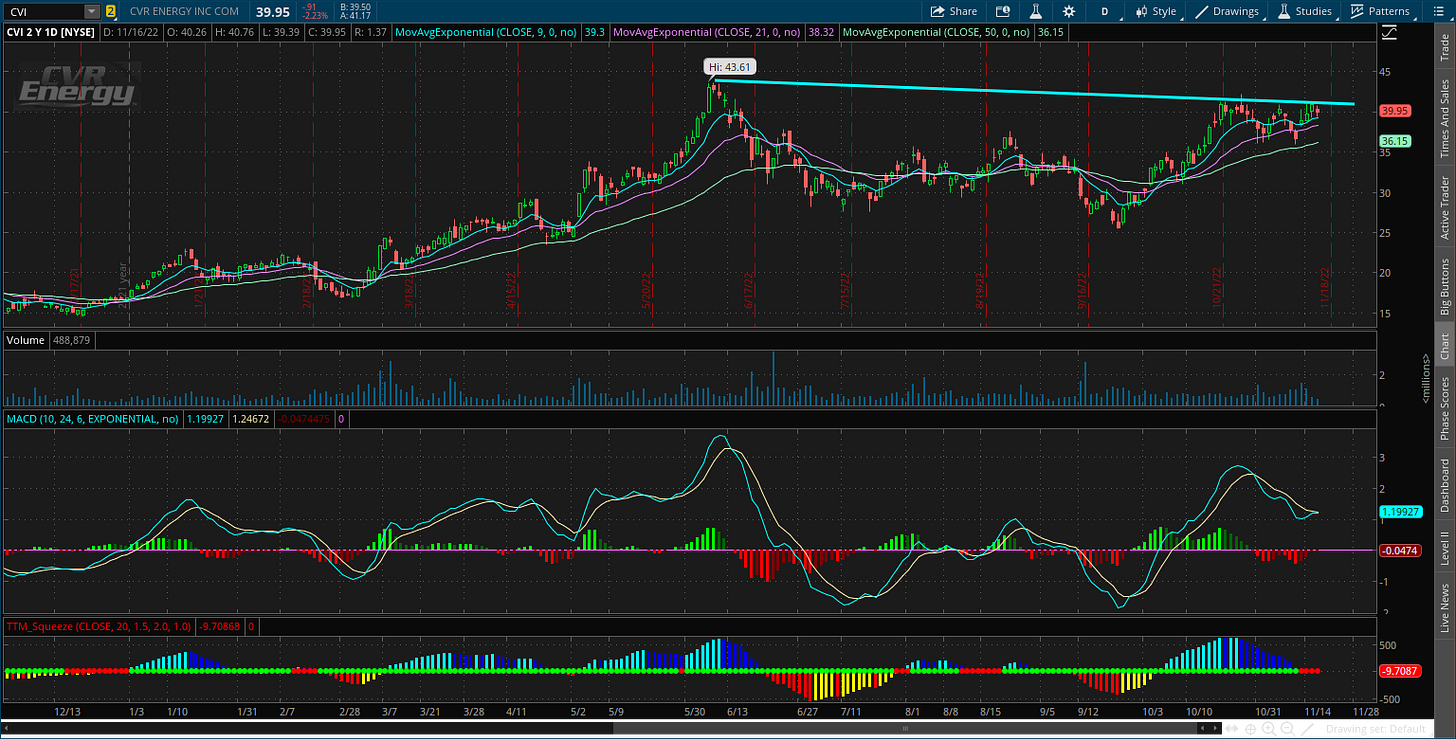
CVI
We’ve had a good run with refining stocks, so lets add another to the watchlist. The MACD has reset at the zero line following a test of the recent highs. Using a close over $42 as a trigger.
ARCH
Trading in a consolidation pattern since April. Starting to show signs that another breakout could be developing. Watching for a move over the $165 level.
RNGR
Price resistance around the $11.50 level tested several times over the past 16 months, and could now be setting up a key breakout. A more speculative smaller-cap name, so position size accordingly.
NDAQ
Holding the breakout from this triangle pattern. Want to see this stock hold above the $65 level to set up a run at prior highs around $70.
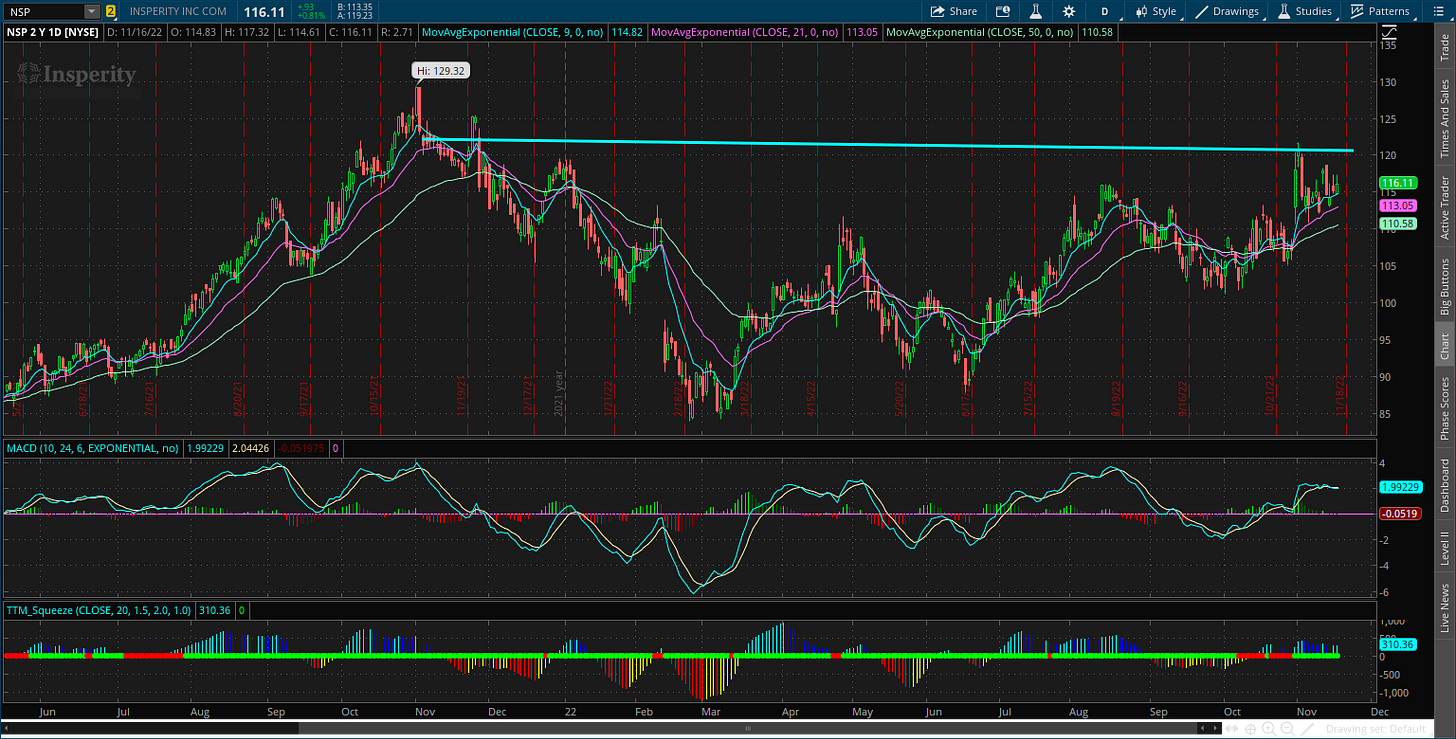
NSP
Basing pattern going back a year creating resistance level at $120. Prefer to see the $110 level hold while it trades within the pattern.
AMN
Ascending triangle pattern that has developed over the past year. Nearing the apex with resistance around $129. Don’t want to see trendline support lost while trading in the pattern.
Short Trade Setups
AMZN
Similar to TSLA mentioned above, price is testing the breakdown point. A move under the $90 level would be the next trigger.
W
Backtested trendline support at the $40 level, which was a significant support level that gave way in September. Next minor support is recent low at $28.
COIN
Crypto-related equity that is setting up to break trendline support at around the $45 level.
DKNG
Stock has tested the $11 support level several times since rebounding off the lows in May. Will keep on watch as this descending triangle pattern develops.
Rules of the Game
If you haven’t noticed yet, I trade breakouts! I trade based on the daily chart for long positions. And for price triggers on long setups, I tend to wait until the last half hour of trading to add a position. I find that emotional money trades the open, and smart money trades the close. If it looks like a stock is breaking out, I don’t want a “head fake” in the morning followed by a pullback later in the day.
Also for long positions, I use the 21-day exponential moving average (EMA) as a stop. If in the last half hour of trading it looks like a position will close under the 21-day EMA, I’m usually selling whether it’s to take a loss or book a profit.
For short (or put) positions, I trade off a four-hour chart instead of a daily. Why? There’s a saying that stocks go up on an escalator and down on an elevator. Once a profitable trade starts to become oversold on the four-hour MACD, I start to take gains. Nothing like a short-covering rally to see your gains evaporate quickly, so I’m more proactive taking profits on short positions. I also use a 21-period EMA on the four-hour chart as a stop. If there is a close above the 21-period EMA, I will cover my short.
For updated charts, market analysis, and other trade ideas, give me a follow on twitter: @mosaicassetco
Disclaimer: these are not recommendations and just my thoughts and opinions…do your own due diligence! I may hold a position in the securities mentioned in this newsletter.


