In this post, I’ll focus on setups that I’m monitoring for both long and short positions. With a chart and short write-up, this is a quick way to scan and plan potential trades.
These ideas are the end result of my process to identify stocks offering the right combination of growth fundamentals along with a proper chart setup.
Stock Market Update
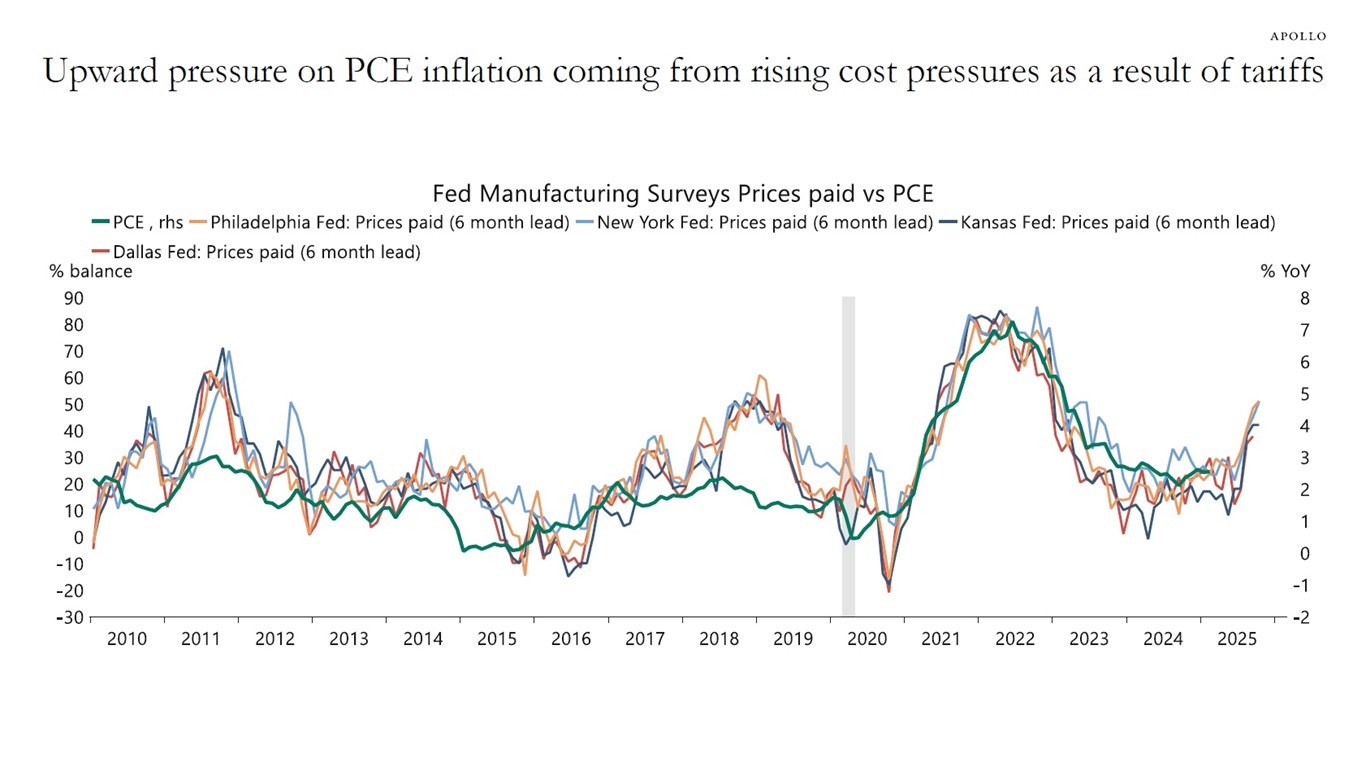
Following their latest rate-setting meeting, the Federal Reserve held interest rates steady at a range of 4.25%-4.50% in a move was widely expected. Investors were more interested in changes to the meeting statement, and what Fed Chair Powell had to say about the outlook considering stagflation forces facing the economy. Powell reiterated a familiar message that the Fed can afford to wait before acting further on monetary policy. Powell also characterized inflation as “moving sideways at a fairly low level.” Despite the perceived lack of concern on the inflation front, it’s worth noting that several Fed district manufacturing surveys are a showing large acceleration in the prices paid component (chart below).
Despite ongoing uncertainty over various trade negotiations and the impact of tariffs on the economy and inflation outlook, the S&P 500 has recovered from the post Liberation Day plunge. The index is also retaking a key level by trading back above the 50-day moving average (MA - black line) for the first time since late February. There are a few key technical hurdles to note in the chart below. The next price resistance level at 5790 also corresponds with the 200-day MA (green line). The RSI in the bottom panel is also at the 60 level, which can serve as an overbought zone if the index is in a downtrend. A period of weak calendar seasonality also hits during mid-May.
It wouldn’t be surprising to see the S&P 500 take a pause and see mean-reversion lower that retraces part of the rally off the lows. But various breadth thrusts off the April bottom bodes well for the longer-term outlook. A smaller pullback would also help several leading stocks complete bullish chart setups that are trading near their prior highs.
Keep reading to see:
Open ETF positions.
Open stock positions.
Chart analysis for new trade ideas.


