

Welcome back to Mosaic Chart Alerts!
In this newsletter, I’ll focus on the best setups that I’m monitoring for both long and short positions. With a chart and short write-up, this is a quick way to scan and plan potential trades.
These ideas are the end result of my process to identify stocks offering the right combination of fundamentals along with a proper chart setup.
Here are my notes from a focus list of setups I’m monitoring.
Stock Market Update
News and economic headlines have taken the S&P 500 on a rollercoaster ride over the past couple weeks. Ongoing fallout from the bank crisis as well as tough talk from central banks on inflation make it feel like the path must be lower in the stock market. Yet since the middle of March, the S&P 500 has been slowly grinding its way higher. Despite gloomy forecasts, I’ve been pointing out recently that market internals favor a rally, even if it’s just a bear market bounce. Sentiment had become too fearful, while breadth metrics were quite oversold. That includes the percent of stocks trading above their 20-day moving average, which is now also flashing a positive divergence this week as I noted in this post:

So despite all the fuss around the bank crisis and Federal Reserve’s steadfast commitment to keeping interest rates high, there’s broadening participation under the hood. That’s also happening just as seasonality becomes a bigger tailwind for stocks over the next month. You can see that in the chart below, where the S&P 500 has been following the historical path of a mid-March turn higher. And over the past 20 years, April has seen gains 80% of the time which is the highest win rate of any calendar month.

I’m not arguing we’re at the dawn of a new bull market. But conditions favor a rally over the near-term and I’m keeping a close eye on my watchlist of long trade setups. There are several great momentum patterns in stocks with strong fundamentals, and were also showing relative strength against broader market weakness in February and early March. There’s one change to the list this week, where I’m removing SKYT from watch in favor a new breakout that I’m monitoring. While the short watchlist remains intact, my focus right now is on the long side of the market.
Keep reading below for all the updates…
Long Trade Setups
REPX
Breaking out over the $35 resistance level as I posted earlier today. Comes on higher volume and a MACD reset at the zero line, while the relative strength (RS) line makes a new high. A smaller-cap oil exploration and production name, so position size accordingly.

SKY
Working up the right side of a basing pattern going back to the end of 2021. That’s brought the relative strength RS line right back to the prior highs, while the MACD is turning higher from the zero line. Looking for an initial move over $73 to target the prior highs.

DRI
Consolidation pattern going back to late 2021, with more recent trading emerging from a tight range. The RS line is making a new 52-week high with price moving over $153 resistance this week.

MPWR
Big run to start the year from around $350 back up to resistance at $535. MACD became extended on that move higher, where a tight trading range since mid-February is helping reset momentum. Looking for a breakout attempt over $535.

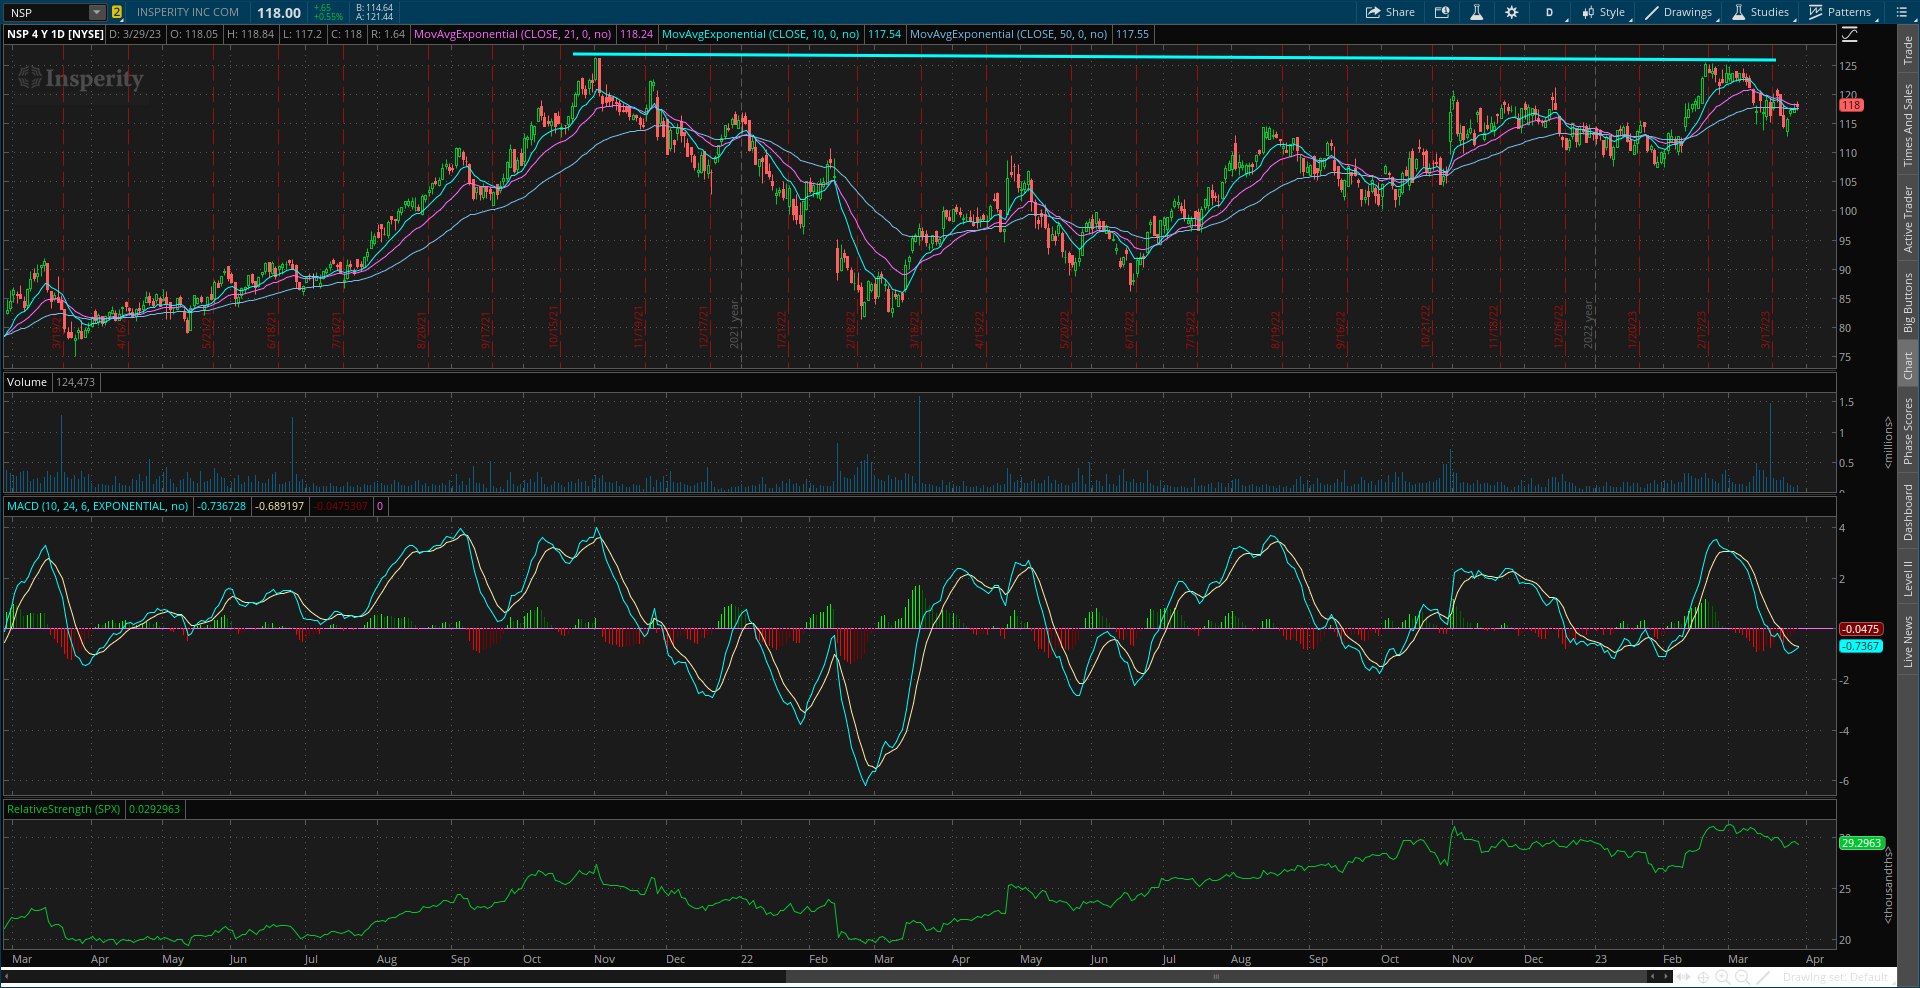
NSP
Ran up to test the $127 resistance level. Momentum became extended on that gain with the MACD now resetting, which helps the breakout setup. RS line still hovering near the highs.
GFS
Recent IPO that tried to break above $70 resistance and failed. The recent gains has the MACD turning up from the zero line while the RS line is near the highs. Looking for another attempt at $70 that can test the prior high at $80.

AVNW
Massive consolidation pattern in the works for nearly two years. Recent move lower is filling the gap at the $33 level. Seeing the MACD reset closer to zero before trying to breakout over the $40 level.

Short Trade Setups
LMND
Currently testing the lows from December around the $13 level. Looking for a move below to confirm next leg of the downtrend, with the RS line at the lows.

AFRM
Trading back at the December lows following a recent MACD reset under the zero line. Looking for price to close under the $8.50 level.

Rules of the Game
If you haven’t noticed yet, I trade breakouts! I trade based on the daily chart for long positions. And for price triggers on long setups, I tend to wait until the last half hour of trading to add a position. I find that emotional money trades the open, and smart money trades the close. If it looks like a stock is breaking out, I don’t want a “head fake” in the morning followed by a pullback later in the day.
New Filter: After extensive back testing and live implementation, I am adding new highs on the RS line as a breakout filter. I find this improves the quality of the price signal and helps prevent false breakouts. So if price is moving out of a chart pattern, I want to see the RS line (the green line in the bottom panel of my charts) at new 52-week highs. Conversely, I prefer an RS line making new 52-week lows for short setups.
Also for long positions, I use the 21-day exponential moving average (EMA) as a stop. If in the last half hour of trading it looks like a position will close under the 21-day EMA, I’m usually selling whether it’s to take a loss or book a profit.
For short (or put) positions, I trade off a four-hour chart instead of a daily. Why? There’s a saying that stocks go up on an escalator and down on an elevator. Once a profitable trade starts to become oversold on the four-hour MACD, I start to take gains. Nothing like a short-covering rally to see your gains evaporate quickly, so I’m more proactive taking profits on short positions. I also use a 21-period EMA on the four-hour chart as a stop. If there is a close above the 21-period EMA, I tend to cover my short.
For updated charts, market analysis, and other trade ideas, give me a follow on Twitter: @mosaicassetco
Disclaimer: these are not recommendations and just my thoughts and opinions…do your own due diligence! I may hold a position in the securities mentioned in this newsletter.