Mosaic Chart Alerts
Fed minutes, a holiday-shortened week, and cracks in the stock market's foundation. NDAQ and COIN patterns complete; two new setups added to the watchlist.
Welcome back to Mosaic Chart Alerts!
In this newsletter, I’ll focus on the best setups that I’m monitoring for both long and short positions. With a chart and short write-up, this is a quick way to scan and plan potential trades.
These ideas are the result of my process to identify stocks offering the right combination of fundamental attributes along with a proper chart setup.
Here are my notes from a shortlist of setups I’m monitoring.
Weekly Recap
Released on Thanksgiving eve, the minutes of the most recent Federal Reserve meeting delivered a mixed bag. While the minutes showed that officials anticipated slowing the pace of rate hikes soon, the ultimate level of interest rates would be higher than expected.
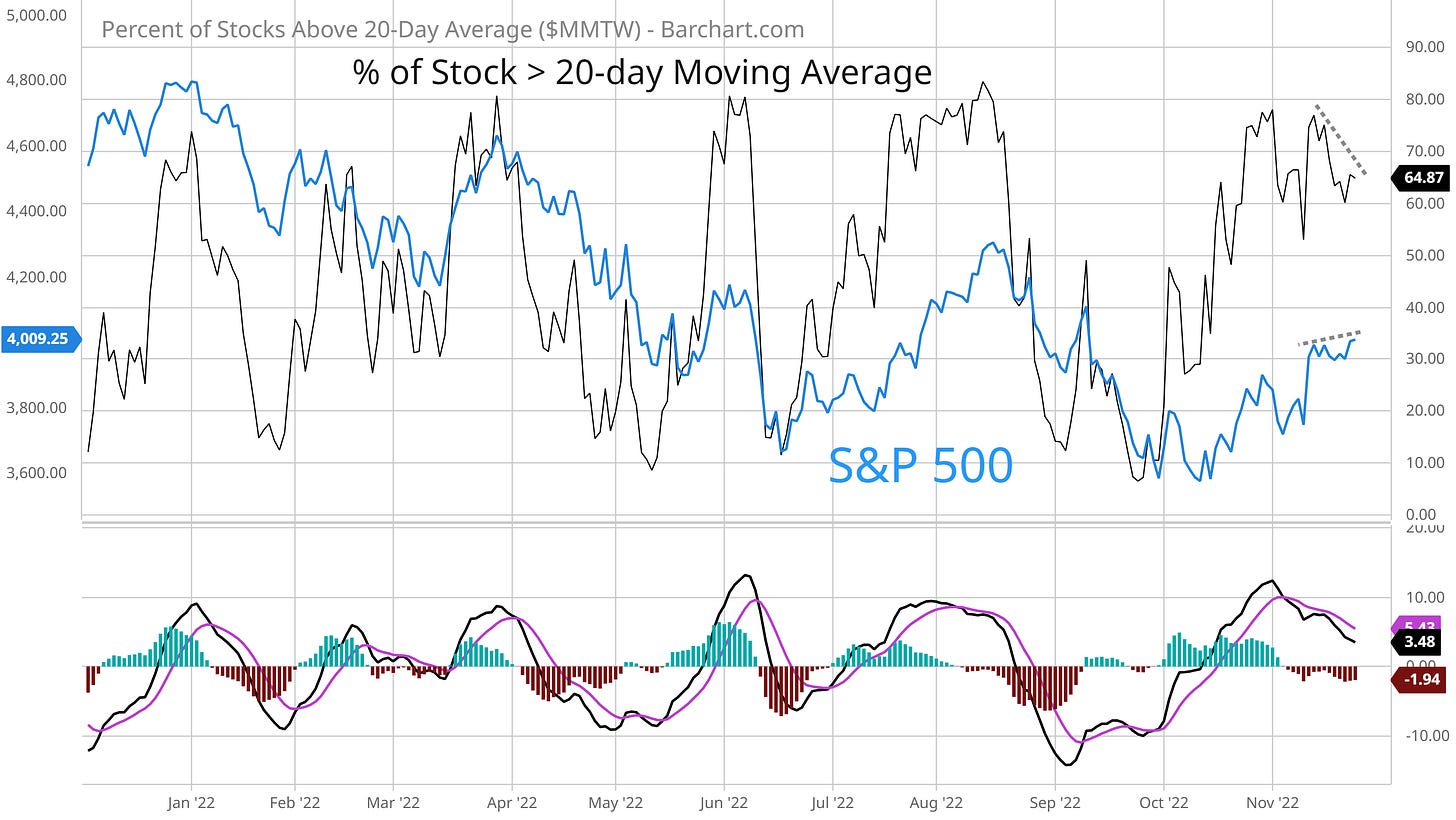
Regardless of how the stock market reaction unfolds in this holiday-shortened week, short-term cracks in the market’s foundation are starting to appear. I’ve noticed several negative breadth divergences even as the S&P 500 has been moving higher over the past month. You can see that below with the percent of stocks trading above their 20-day moving average. As the S&P makes a higher high with this rally off the October lows, fewer stocks are in short-term uptrends (shown with the dashed lines). I also noted something similar with the McClellan Oscillator, which is another way to measure breadth that I posted about here.
Over the past week, we’ve seen setups completing on both the long and short side. I’m removing NDAQ from long setups as the stock completed its pattern and has held above levels I discussed last week. I’m also removing COIN from our short setups. The volatility and events in the crypto space sent COIN under the $45 support level that I’ve highlighted for several weeks now. With those stocks coming off, I’m making a couple new additions to the list…keep reading for updates.
Long Trade Setups
KEYS
Creating a resistance level around the $177-$180 area since August. Watching for a move over $180, which could see the stock test prior highs at $210.
CVI
We’ve had a good run with refining stocks, and this is another setting up. The MACD has reset at the zero line following a test of the recent highs. Using a close over $42 as a trigger.
ARCH
Trading in a consolidation pattern since April. Starting to show signs that another breakout could be developing. Watching for a move over the $165 level.
RNGR
Price resistance around the $11.50 level tested several times over the past 16 months, and could now be setting up a key breakout. A more speculative smaller-cap name, so position size accordingly.
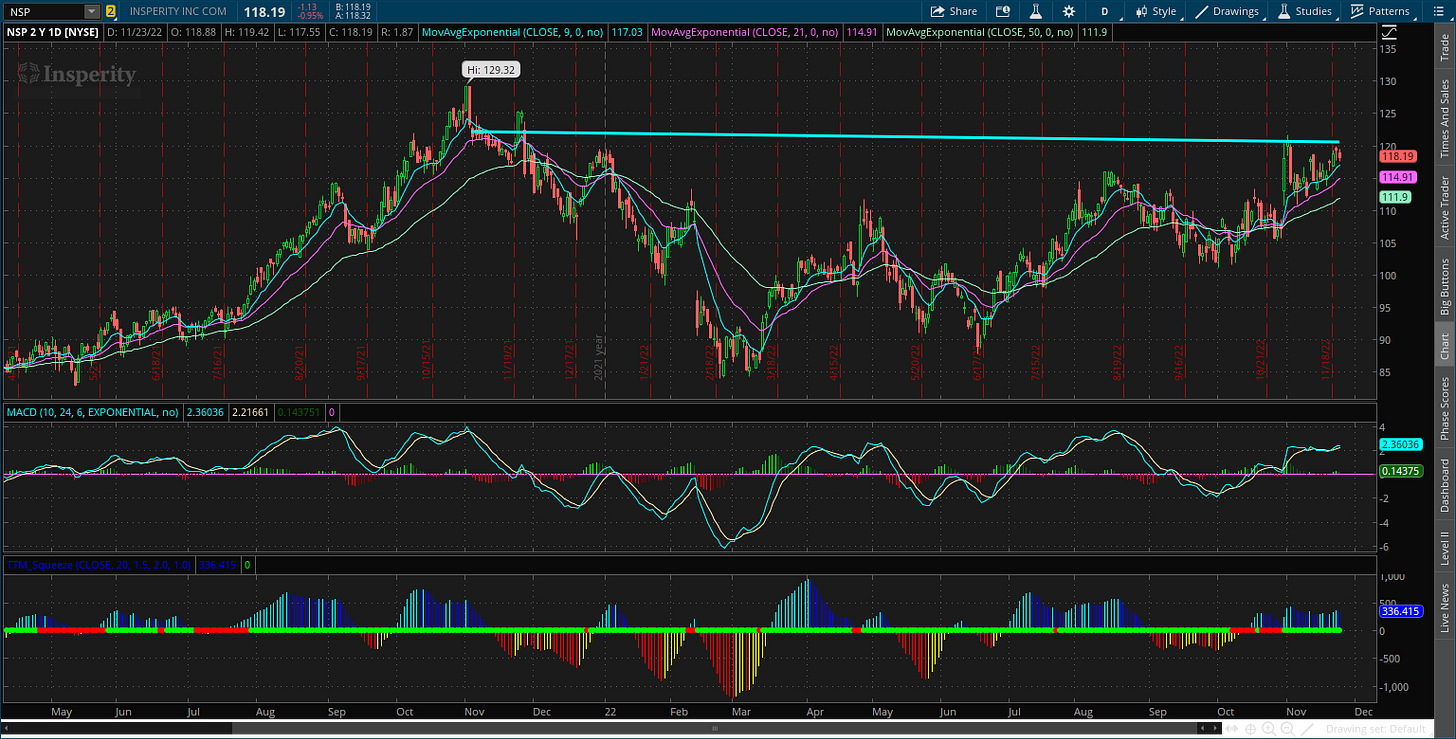
NSP
Basing pattern going back a year creating resistance level at $120. Prefer to see the $110 level hold while it trades within the pattern.
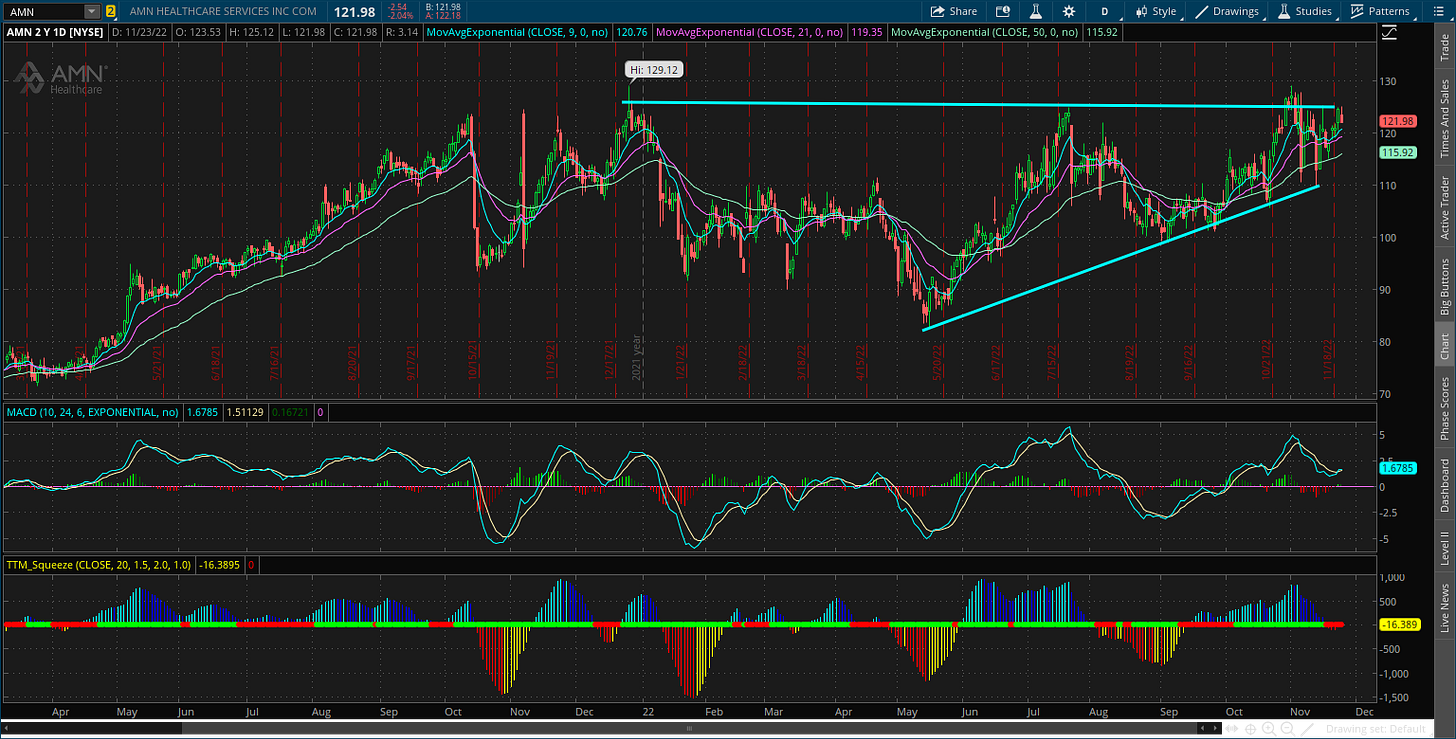
AMN
Ascending triangle pattern that has developed over the past year. Nearing the apex with resistance around $129. Don’t want to see trendline support lost while trading in the pattern.
Short Trade Setups
CUBI
Crypto-linked bank testing the $30 level several times in the last couple months, creating a bear flag pattern.
AMZN
Price tested the $105 breakdown point. A move under the $90 level would be the next trigger.
W
Backtested trendline support at the $40 level, which was a significant support level that gave way in September. Next minor support is recent low at $28.
DKNG
Stock has tested the $11 support level several times since rebounding off the lows in May. Will keep on watch as this descending triangle pattern develops.
Rules of the Game
If you haven’t noticed yet, I trade breakouts! I trade based on the daily chart for long positions. And for price triggers on long setups, I tend to wait until the last half hour of trading to add a position. I find that emotional money trades the open, and smart money trades the close. If it looks like a stock is breaking out, I don’t want a “head fake” in the morning followed by a pullback later in the day.
Also for long positions, I use the 21-day exponential moving average (EMA) as a stop. If in the last half hour of trading it looks like a position will close under the 21-day EMA, I’m usually selling whether it’s to take a loss or book a profit.
For short (or put) positions, I trade off a four-hour chart instead of a daily. Why? There’s a saying that stocks go up on an escalator and down on an elevator. Once a profitable trade starts to become oversold on the four-hour MACD, I start to take gains. Nothing like a short-covering rally to see your gains evaporate quickly, so I’m more proactive taking profits on short positions. I also use a 21-period EMA on the four-hour chart as a stop. If there is a close above the 21-period EMA, I tend to cover my short.
For updated charts, market analysis, and other trade ideas, give me a follow on twitter: @mosaicassetco
Disclaimer: these are not recommendations and just my thoughts and opinions…do your own due diligence! I may hold a position in the securities mentioned in this newsletter.


