

In this post, I’ll focus on setups that I’m monitoring for both long and short positions. With a chart and short write-up, this is a quick way to scan and plan potential trades.
These ideas are the end result of my process to identify stocks offering the right combination of growth fundamentals along with a proper chart setup. Live alerts are sent to Traders Hub members only.
Stock Market Update
The narrative driving the stock market has hardly changed in recent weeks. Optimism around a potential peace deal between the U.S. and Iran helps to spark a rally in the major indexes. For the most part, there has been very little substance behind the headlines, but that hasn’t stopped the rally in stocks linked to the AI infrastructure buildout. At the same time, challenges to the inflation outlook continue building. The Federal Reserve’s preferred inflation gauge - the Personal Consumption Expenditures (PCE) price index - was released for the month of April. The headline figure jumped by 3.8% compared to last year while the core figure that excludes food and energy prices rose by 3.3%. For investors hoping that the boost in inflation could be temporary from the jump in energy prices, the report contained bad news. The core goods figure that excludes food and energy rose by 2.8% and is one of the biggest increases in decades outside of the pandemic aftermath.
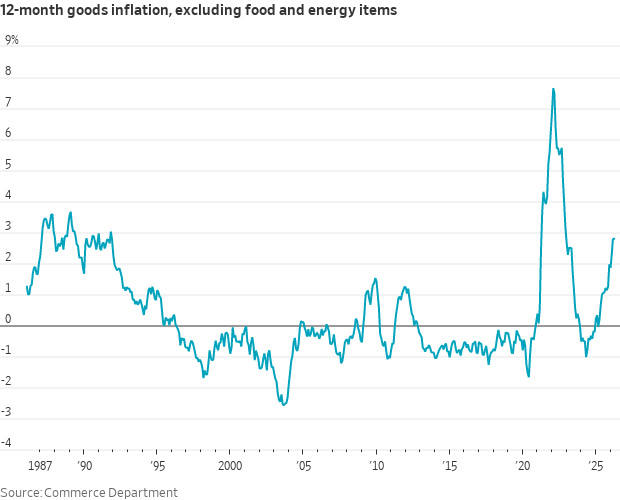
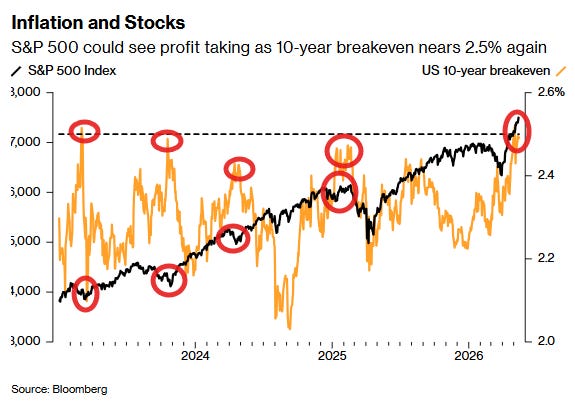
That shows underlying inflation has been a growing issue even before the spike in energy prices, and likely reflects supply chain upheaval from last year’s trade war. The major stock indexes continue grinding higher despite rising inflation and the impact on interest rates across the yield curve and outlook for monetary policy. But market-based inflation expectations are nearing levels that have posed issues for stock prices in the past. The chart below plots the S&P 500 along with the 10-year inflation breakeven rate. A push toward the 2.5% level on inflation breakevens has pressured the S&P 500 over the past few years, and is nearing that level once again.
Since last week, there’s been an improvement in the rally’s participation as short-term breadth turns higher from an oversold level. An increase in bearish investor sentiment has been a tailwind as well. While it’s been difficult finding new setups offering low risk entry points, open positions continue working higher while respecting key moving averages. Keep reading to see:
Open ETF positions.
Open stock positions.
Chart analysis for new trade ideas.
