

Welcome back to Mosaic Chart Alerts!
In this post, I’ll focus on setups that I’m monitoring for both long and short positions. With a chart and short write-up, this is a quick way to scan and plan potential trades.
These ideas are the end result of my process to identify stocks offering the right combination of fundamentals along with a proper chart setup.
Here are my notes from a focus list of setups I’m monitoring.
Stock Market Update
This week was setup to see plenty of headline driven volatility. While corporate earnings continue rolling in, the economic calendar features key PMI reports on manufacturing and service sector activity along with the July payrolls report. Stocks also received a surprise when Fitch downgraded the U.S. credit rating to AA+ from AAA. That sent U.S. Treasury yields sharply higher as you can see in the chart below. It shows the 10-year yield, which I discussed could breakout in last week’s Market Mosaic and the ramifications for the stock market.

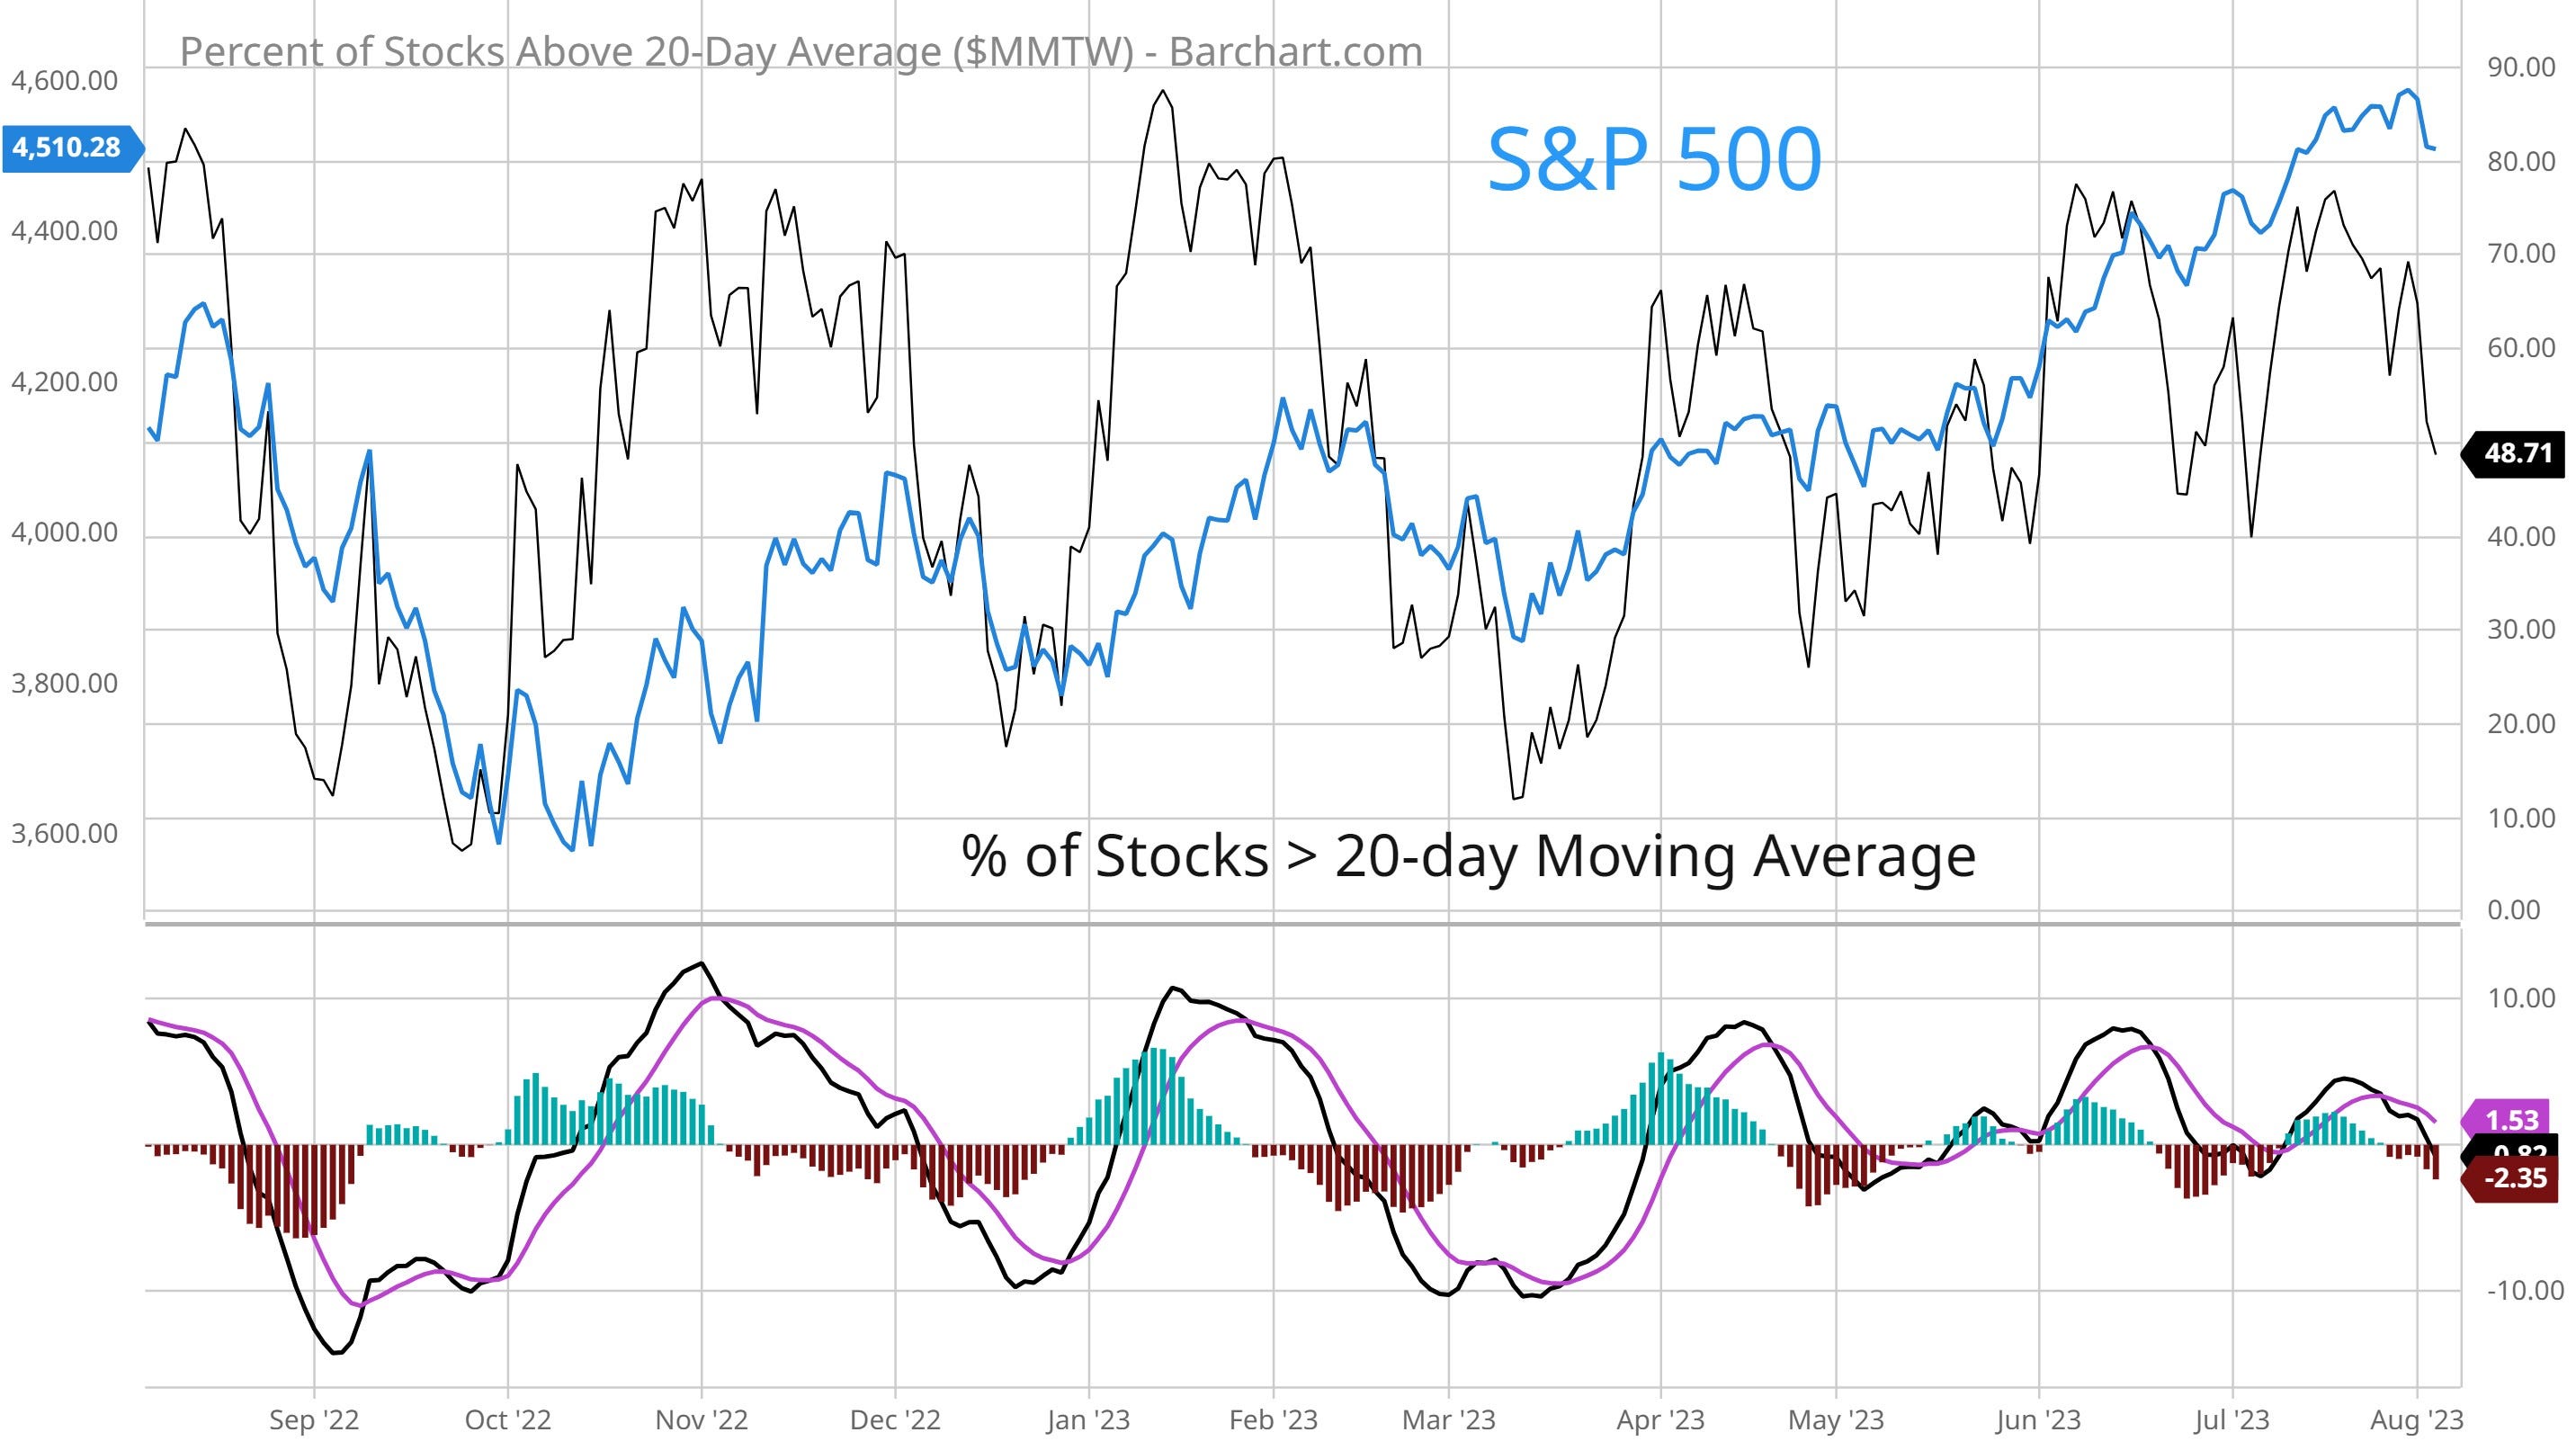
Regardless of what happens amidst the headlines, stocks were due for a break. The S&P 500 rallied 9% since breaking out over 4200 at the start of June. But now momentum is becoming extended, bullish investor sentiment is reaching extremes, and weaker seasonality sets in for the next few weeks (as I covered here). Now I’ll be watching shorter-term breadth metrics for signs that the market is becoming oversold. A couple of my preferred measures include the percent of stocks trading above their 20-day moving average (the first chart below where I look for an oversold level of 30-40% in an uptrend) and the McClellan Oscillator (second chart below where a reading of -50 or lower signals oversold). Both measures have moved off overbought levels, but there is room for additional downside before these metrics hit oversold territory.

As open positions hit trailing stops, I am raising cash and monitoring for the next round of breakout setups. This is where focusing on weekly charts becomes important for my position-trading process. Among stocks screening well on fundamentals like sales/earnings growth, return on capital, and analyst revisions, I scan charts showing consolidations lasting weeks to months where the relative strength (RS) line is hovering near 52-week highs. With those parameters in mind, I have a couple new additions to the watchlist this week. I’m removing SKX from watch following the stock’s breakout (which is now backtesting the breakout level). I’m also removing NABL as the stock drifts lower and the RS line weakens.
Keep reading below for all the updates…
Long Trade Setups
SQSP
Working higher after a long bottoming base from last year. More recent consolidation since April keeps testing resistance at around the $33 level. MACD turning higher from zero with the RS line near the highs.

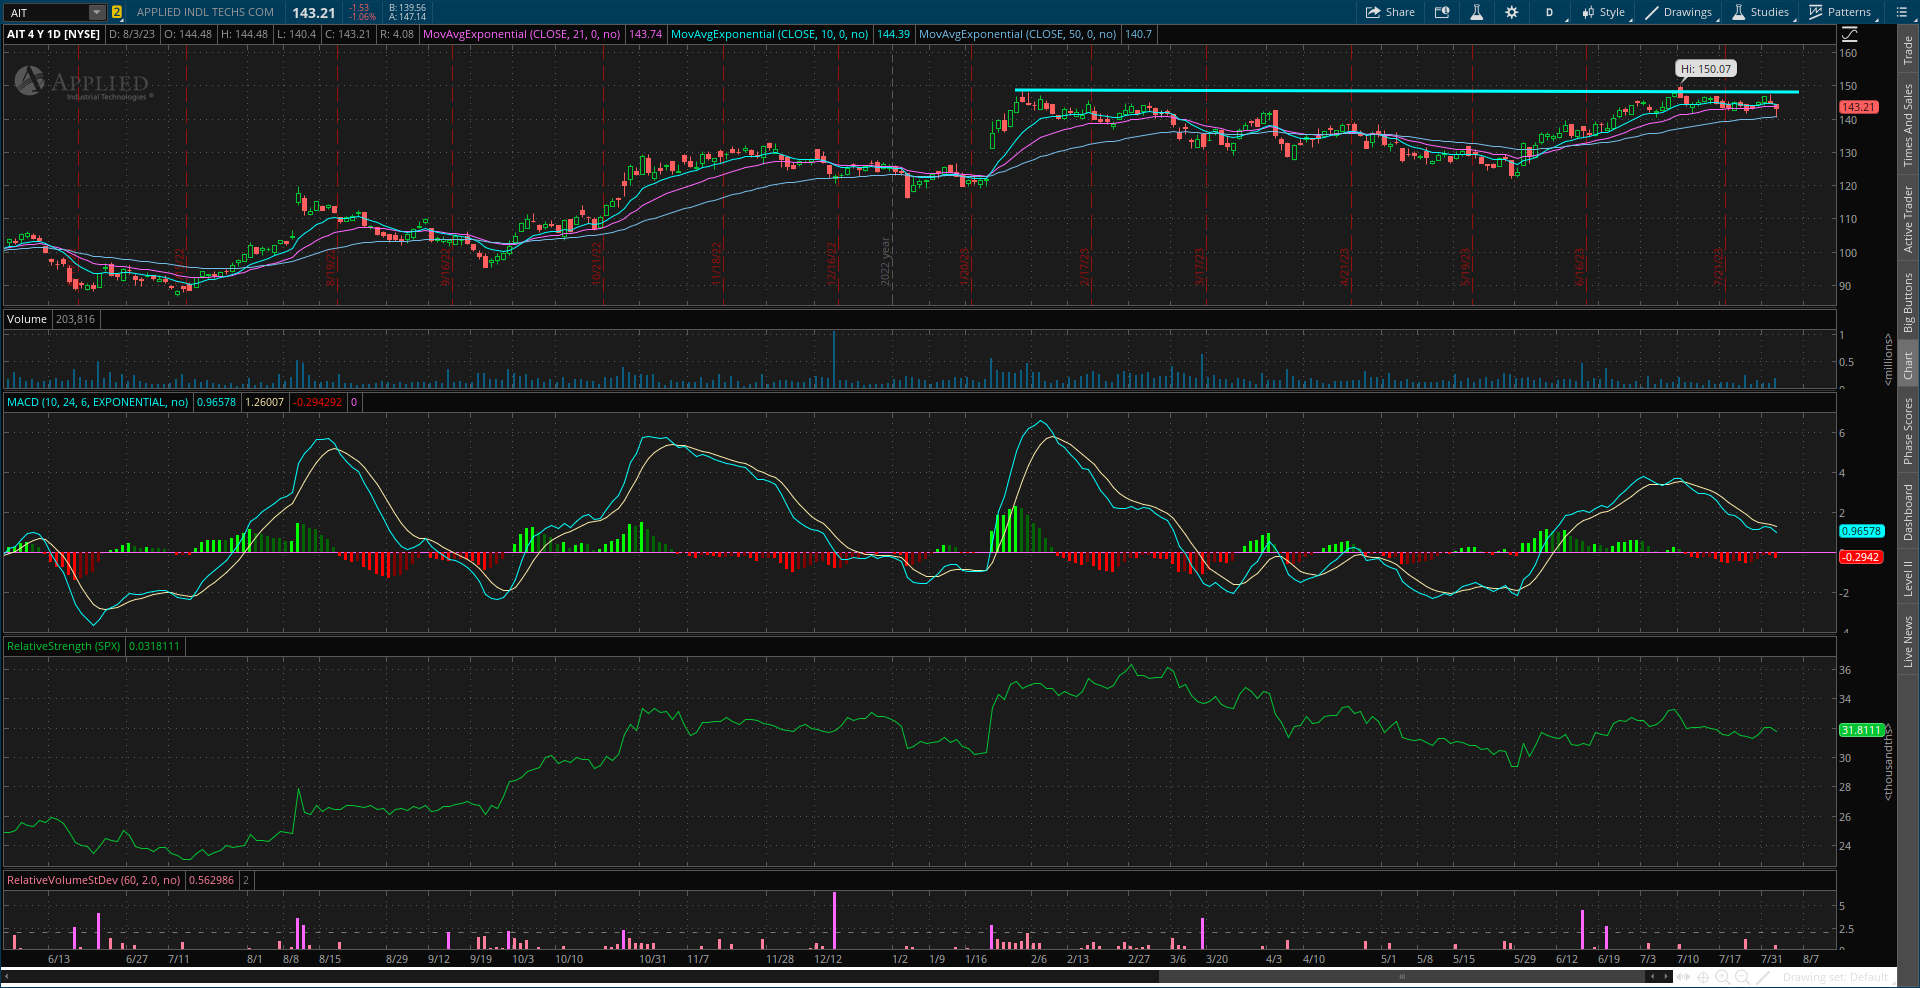
AIT
Consolidating since making a new high in early February. The stock is recently trading at the high end of the consolidation range and tested resistance at around the $147 level. Looking for a breakout to new highs.
ONON
The basing pattern is not as tight as I prefer, but similar to an ascending triangle going back to the May peak. Choppy price action since attempting to breakout a couple weeks ago, but now starting to firm up on the move over $35.

TX
Massive consolidation base going back nearly two years. Watching for a move over $45, followed by a test of the prior highs around $52. Would prefer to see the MACD reset near zero before attempting a breakout with support holding at $40.

HGBL
Took this chart back to 2020 to show the importance of the $4 area. That prior high was tested recently, with the stock now pulling back since late June. That’s resetting the MACD at the zero line, which is trying to turn higher. Looking for a move over $4.15. More volatile small-cap name, so position size accordingly.

MOMO
Consolidating since January as part of an overall bottoming base. Looking for a move over $10-11 to signal the start of the next move higher. Recent MACD reset at zero is constructive as well.

IOT
Price rallied to the post-IPO highs around $30. Still pulling back from that level, with the MACD resetting at zero but the relative strength (RS) line starting to weaken. A breakout over $30 with the RS line at a new high and the MACD turning up from zero is my ideal trade scenario.

CIVI
Energy exploration and production company trying to move out of this triangle pattern. Price is moving above trendline resistance, and now watching for new all-time highs.

Short Trade Setups
None this week!
Rules of the Game
I trade chart breakouts based on the daily chart for long positions. And for price triggers on long setups, I tend to wait until the last half hour of trading to add a position. I find that emotional money trades the open, and smart money trades the close. If it looks like a stock is breaking out, I don’t want a “head fake” in the morning followed by a pullback later in the day.
I also use the RS line as a breakout filter. I find this improves the quality of the price signal and helps prevent false breakouts. So if price is moving out of a chart pattern, I want to see the RS line (the green line in the bottom panel of my charts) at new 52-week highs. Conversely, I prefer an RS line making new 52-week lows for short setups.
Also for long positions, I use the 21-day exponential moving average (EMA) as a stop. If in the last half hour of trading it looks like a position will close under the 21-day EMA, I’m usually selling whether it’s to take a loss or book a profit.
For short (or put) positions, I trade off a four-hour chart instead of a daily. Why? There’s a saying that stocks go up on an escalator and down on an elevator. Once a profitable trade starts to become oversold on the four-hour MACD, I start to take gains. Nothing like a short-covering rally to see your gains evaporate quickly, so I’m more proactive taking profits on short positions. I also use a 21-period EMA on the four-hour chart as a stop. If there is a close above the 21-period EMA, I tend to cover my short.
For updated charts, market analysis, and other trade ideas, give me a follow on Twitter: @mosaicassetco
Disclaimer: these are not recommendations and just my thoughts and opinions…do your own due diligence! I may hold a position in the securities mentioned in this post.