

Welcome back to Mosaic Chart Alerts!
In this post, I’ll focus on setups that I’m monitoring for both long and short positions. With a chart and short write-up, this is a quick way to scan and plan potential trades.
These ideas are the end result of my process to identify stocks offering the right combination of fundamentals along with a proper chart setup.
Here are my notes from a focus list of setups I’m monitoring.
Stock Market Update
While investors await this week’s main event, the stock market is already reflecting a combination of conditions to support a rally. For the past couple weeks, I’ve highlighted oversold breadth, increasingly bearish sentiment, and an upcoming period of positive seasonality. The recent clue that the stock market could resume the uptrend was positive divergences in breadth indicators, showing that the average stock is performing better than the primary indexes like the S&P 500. Those positive divergences have been enough to turn the McClellan Summation Index higher, which is closing in on a positive crossover signal over the 10-period moving average as you can see below.

While we still have key reports on manufacturing and service sector activity coming up along with the August payrolls report, seasonality and sentiment can support more broad gains ahead. There are many ways to gauge the mood of the crowd. The AAII survey of retail investors showed that there are more bears than bulls for the first time in three months. Another survey of professional money managers saw a spike in bearishness as well with the NAAIM Exposure Index. This survey looks at exposure to the stock market among active money managers, with the index plunging to the lowest level since late last year (chart below). With positive seasonality through late September, sentiment surveys indicate that there could be plenty of dry powder on the sidelines.

The better trading environment is also being reflected by more breakouts among stocks on the watchlist. I’m focusing on stocks with strong growth fundamentals that are emerging from basing patterns with confirmation by a strong relative strength (RS) line. This week, I’m removing MNSO, CSPI, and FRO as each stock is breaking out and completing their chart pattern. I’m also removing SQSP as price weakens and better setups become available. That clears the way for several new additions to the watchlist this week.
Keep reading below for all the updates…
Long Trade Setups
COCO
Basing action since mid-June with resistance around the $29 level. MACD and the RS line in a good position as price turns higher to test resistance again. Looking for a breakout over that level on increasing volume.

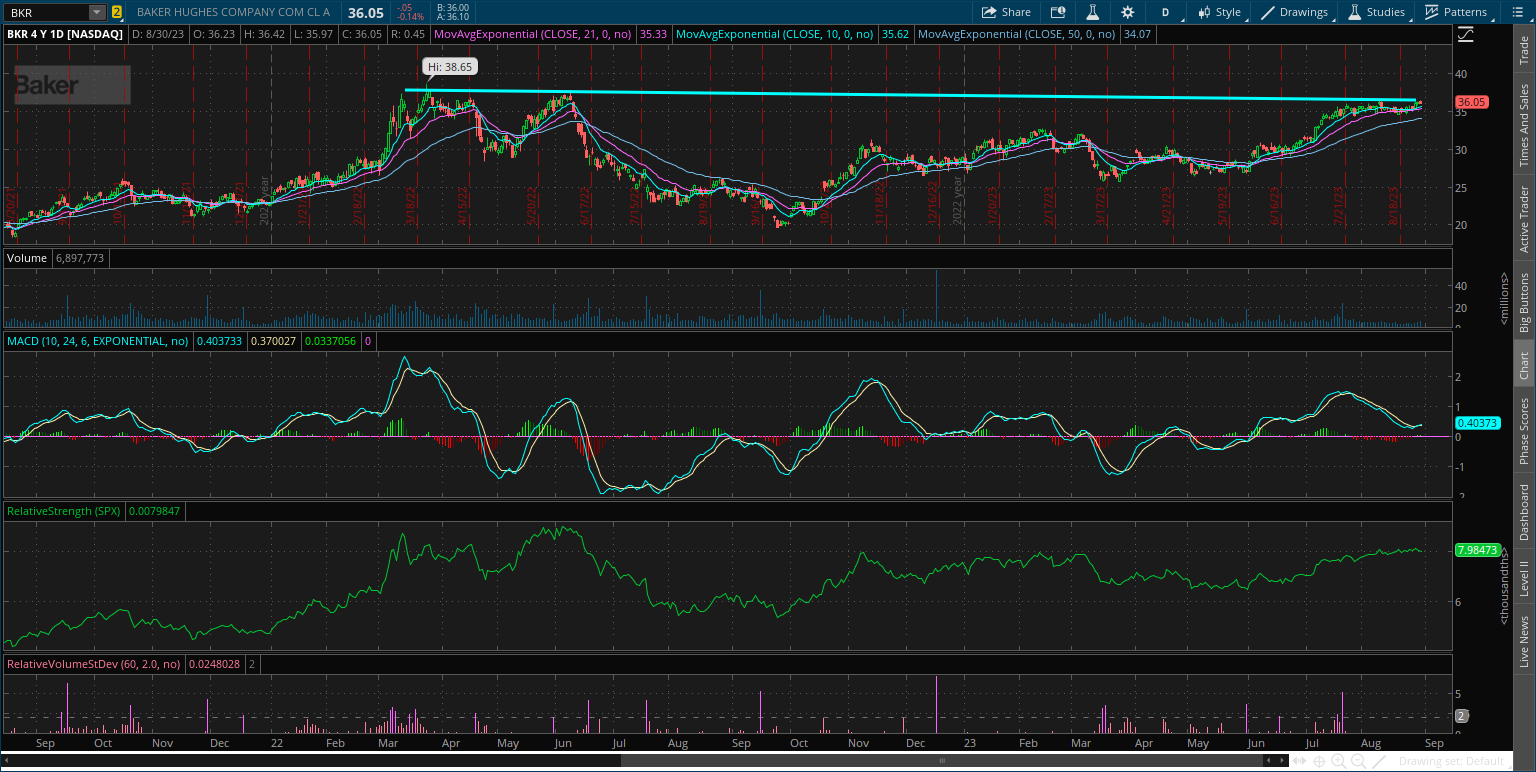
BKR
Price recently rallying back to the highs made in early 2022, and now trading in a tight range for the past month. That recent consolidation has reset the MACD at the zero line. Watching for a breakout over the $37 level.
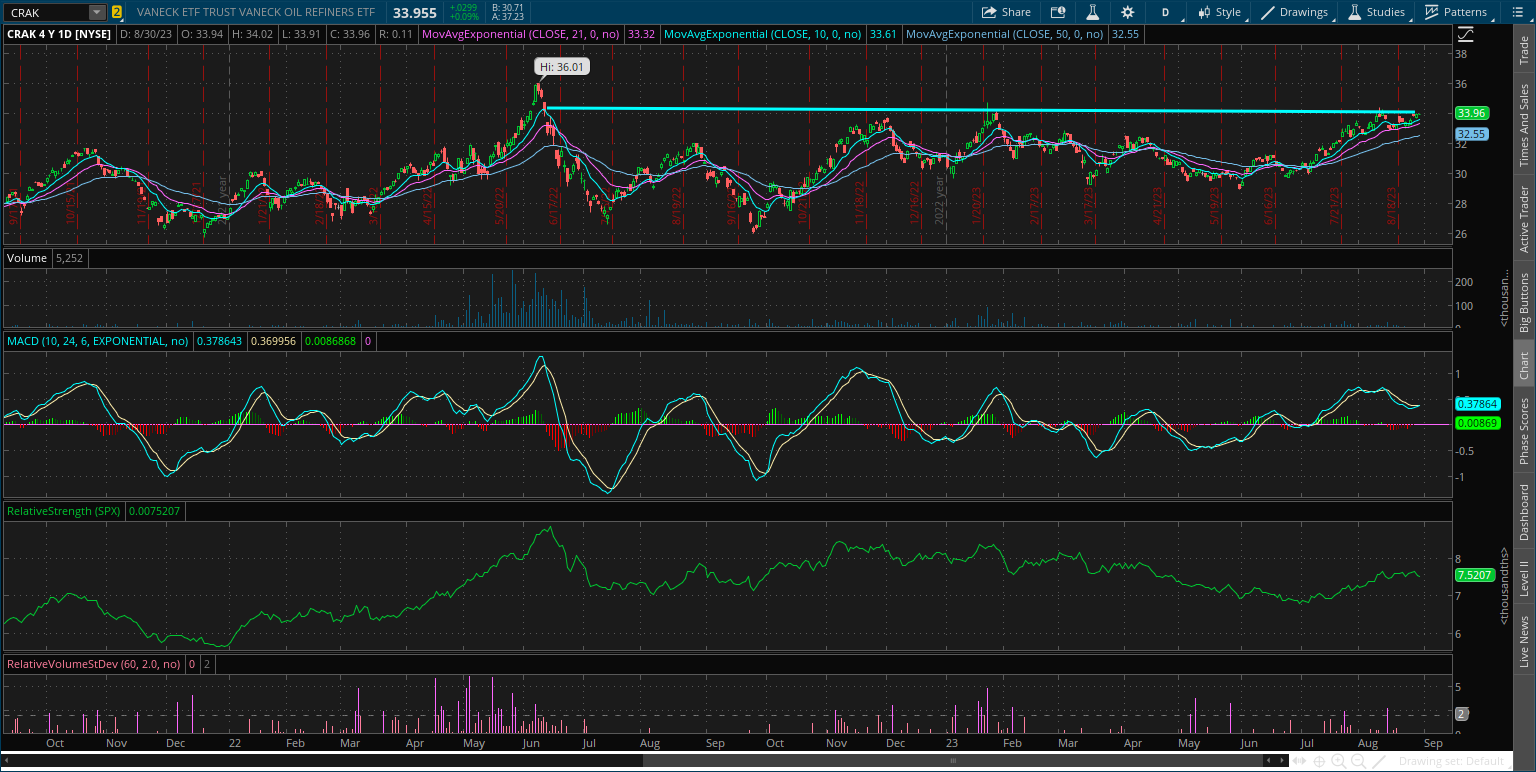
CRAK
Refining company ETF making a series of higher lows since last September while testing resistance around $34 several times since then. Smaller drawdown following most recent test constructive for a breakout.
BG
Recent rally came close to the highs made in early 2022. The pullback off that level making a bull flag pattern with the MACD resetting at the zero line. Watching for a move over $116 followed by a breakout to new highs.

AIT
Made a gap over the $150 resistance level following earnings, but came back to fill the gap which was also around the 50-day MA. Rallying off that level and now watching for a move over $155.

NAT
Recently testing the $4.50 resistance level and pulling back, which is resetting the MACD at zero. RS line also in a good position on a breakout. Smaller-cap and volatile stock so position size accordingly.

NVGS
Putting this stock back on the watchlist as price firms up and makes a run toward resistance around the $15 level. MACD in a good position to support a breakout, while I would like to see more improvement in the RS line.

TX
Massive consolidation base going back nearly two years. Watching for a move over $45, followed by a test of the prior highs around $52. Would prefer to see price support hold at the $40 level on the recent pullback.

Short Trade Setups
None this week!
Rules of the Game
I trade chart breakouts based on the daily chart for long positions. And for price triggers on long setups, I tend to wait until the last half hour of trading to add a position. I find that emotional money trades the open, and smart money trades the close. If it looks like a stock is breaking out, I don’t want a “head fake” in the morning followed by a pullback later in the day.
I also use the RS line as a breakout filter. I find this improves the quality of the price signal and helps prevent false breakouts. So if price is moving out of a chart pattern, I want to see the RS line (the green line in the bottom panel of my charts) at new 52-week highs. Conversely, I prefer an RS line making new 52-week lows for short setups.
Also for long positions, I use the 21-day exponential moving average (EMA) as a stop. If in the last half hour of trading it looks like a position will close under the 21-day EMA, I’m usually selling whether it’s to take a loss or book a profit.
For short (or put) positions, I trade off a four-hour chart instead of a daily. Why? There’s a saying that stocks go up on an escalator and down on an elevator. Once a profitable trade starts to become oversold on the four-hour MACD, I start to take gains. Nothing like a short-covering rally to see your gains evaporate quickly, so I’m more proactive taking profits on short positions. I also use a 21-period EMA on the four-hour chart as a stop. If there is a close above the 21-period EMA, I tend to cover my short.
For updated charts, market analysis, and other trade ideas, give me a follow on Twitter: @mosaicassetco
Disclaimer: these are not recommendations and just my thoughts and opinions…do your own due diligence! I may hold a position in the securities mentioned in this post.