

In this post, I’ll focus on setups that I’m monitoring for both long and short positions. With a chart and short write-up, this is a quick way to scan and plan potential trades.
These ideas are the end result of my process to identify stocks offering the right combination of growth fundamentals along with a proper chart setup.
You can sign up for a 7-day free trial here and unlock the trade ideas in this report.
Stock Market Update
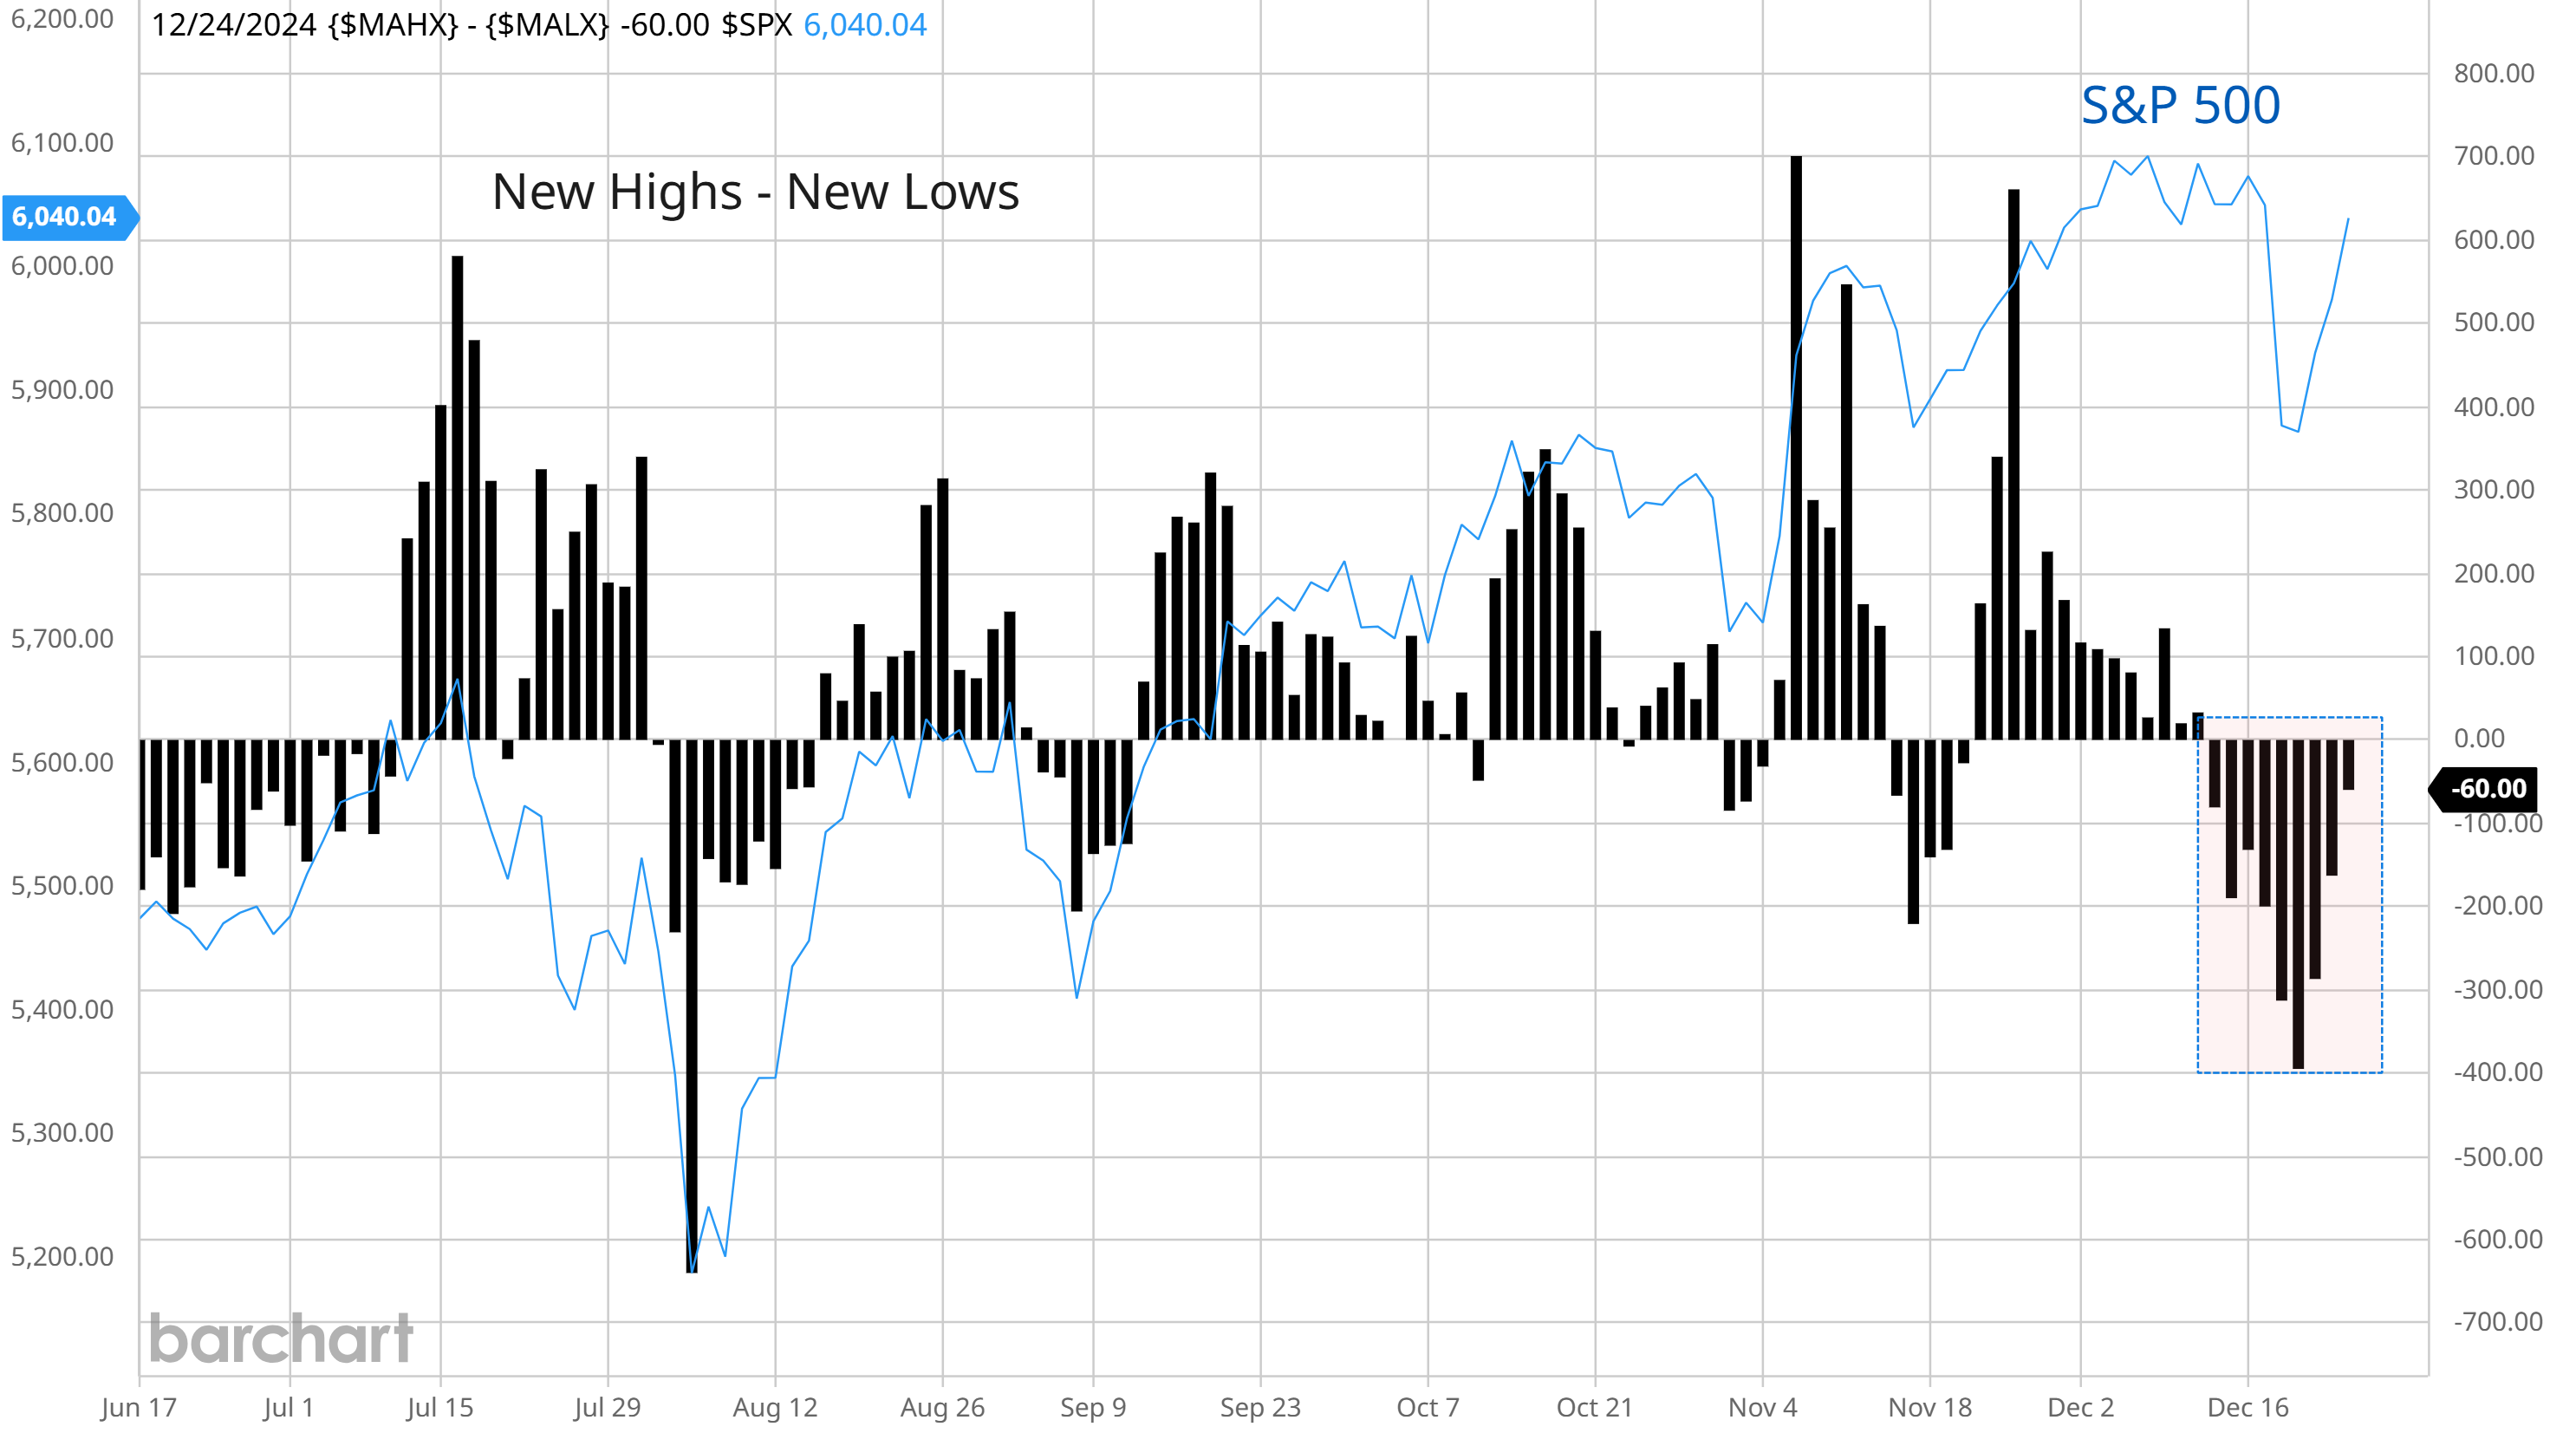
The month of December is shaping up to be a tale of two halves. The first half of the month featured the worst daily run of declining stocks outpacing advancers on the S&P 500 in 46 years. The broader market also shifted to a regime of seeing more 52-week lows than highs on December 12, with net new 52-week highs still stuck in negative territory as you can see in the chart below. The S&P 500 finally started to “catch down” to the average stock following the Federal Reserve’s last meeting of the year, which is when the central bank warned that stalling disinflation meant that fewer rate cuts are in store for next year.
But recent signs of capitulation are delivering a rally just in time for a favorable seasonal period. As I shared in this week’s Market Mosaic, extremely oversold breadth conditions and evidence of investor panic in volatility markets are helping stocks find their footing. After briefly cutting through the 50-day moving average, the S&P 500 is quickly recovering from one of its worst daily drops of the year. You’re also seeing the average stock rebound following extremely oversold conditions. On the day marking the start of the Santa Claus rally, the NYSE advance/decline ratio hit 5.5/1. That’s the best ratio of advancing stocks to decliners since September as you can see at the arrow in the chart below.

Oversold conditions, signs of investor panic, and excessive bearish investor sentiment are helping spark a rally just as a favorable seasonal period arrives. The period covering the Santa Claus rally covers the final five trading days of the year along with the first two trading sessions of the New Year. Last year saw a negative return for the S&P 500 during the period. That followed a run of seven consecutive years seeing a gain. On average, the period sees a gain 77% of the time with an average return of 1.6% since 1950.
Following the recent run of poor breadth, the average stock is perking up. I notified members of another breakout last week, with more setups still developing. Keep reading below to see:
Open ETF positions.
Open stock positions.
Chart analysis for new trade ideas.
