Mosaic Chart Alerts
S&P 500 testing key resistance levels while more energy stocks breaking out.
Welcome back to Mosaic Chart Alerts!
In this newsletter, I’ll focus on the best setups that I’m monitoring for both long and short positions. With a chart and short write-up, this is a quick way to scan and plan potential trade ideas.
And to select these ideas, a lot of work goes on behind the scenes to find stocks offering the right combination of fundamental attributes along with a proper chart setup.
These are my notes from a shortlist of setups I’m monitoring.
Weekly Recap
In Sunday’s Market Mosaic, I talked about the positive short-term setup in the stock market as fewer stocks were trading in downtrends even as the S&P 500 tested 2022’s lows. We’ve seen that positive divergence play out this week with more gains. Wednesday’s price action exemplifies the improving conditions when you peek underneath the hood. That’s because despite the S&P 500’s decline, there were more advancing stocks relative to declining ones on the NYSE. That doesn’t mean I’m declaring the bear market to be over. The bigger picture forces driving the downside in stocks are still present, but it won’t be a straight line lower and bear markets can deliver some pretty epic rallies.
The next key test for this current rally is to watch how the S&P 500 handles the 50-day moving average. I’ve included the chart below, where you can see the index has so far rejected off that level. The MACD and RSI in the bottom panels are also reaching levels that ended a few rally attempts earlier this year. That sets up an important level to watch as third quarter earnings roll in along with another highly anticipated Fed meeting next week.
Regardless, I’m encouraged that this rally could have more room to run based on the performance of the average stock and an expansion of breakouts among setups that I’m following. We’ve seen several names on our long watchlist hold their breakouts, including TDW and BOWL. I’m removing those stocks from the list, along with LYTS which never broke out and is displaying poor price action with a move below its 50-day moving average. SE will come off the short watchlist following its breakdown. Most other setups on the short side are still trading around key support levels, so those will be in focus if the bear market reasserts itself. Keep reading for updates to the watchlist this week.
Long Trade Setups
DK
Another refining stock setting up a breakout from this triangle consolidation pattern. Watching for a move over the $30 level for confirmation.
DVN
Noted this energy stock in last week’s The Market Mosaic and wanted to mention here as well. Starting to breakout from this pattern; next level to watch is the prior high around $80.
UI
Choppy sideways trading pattern going back to the start of 2021. Momentum improving and now taking out first important resistance level at $340.
LW
Pattern since start of 2021 has a deeper than ideal structure, but the more shallow consolidation since testing the $85 breakout level in August is a nice sign of relative strength. Would like to see MACD reset before attempting to take out $85.
IRDM
Two big levels in play as the stock breaks out from a lengthy consolidation pattern. Want to see this stock hold over $47, and breakout over $50 next to set up a test of the prior highs at $55.
NC
Volatile coal stock that’s trying to breakout. This week saw a big jump to test the prior 52-week highs at $60 then pulled back. Would prefer to see the 21-day MA hold while setting up another run at $60. Position size accordingly with this name.
Short Trade Setups
SI
Showing the daily chart of this crypto-linked bank to highlight the big support level in play at $50.
S
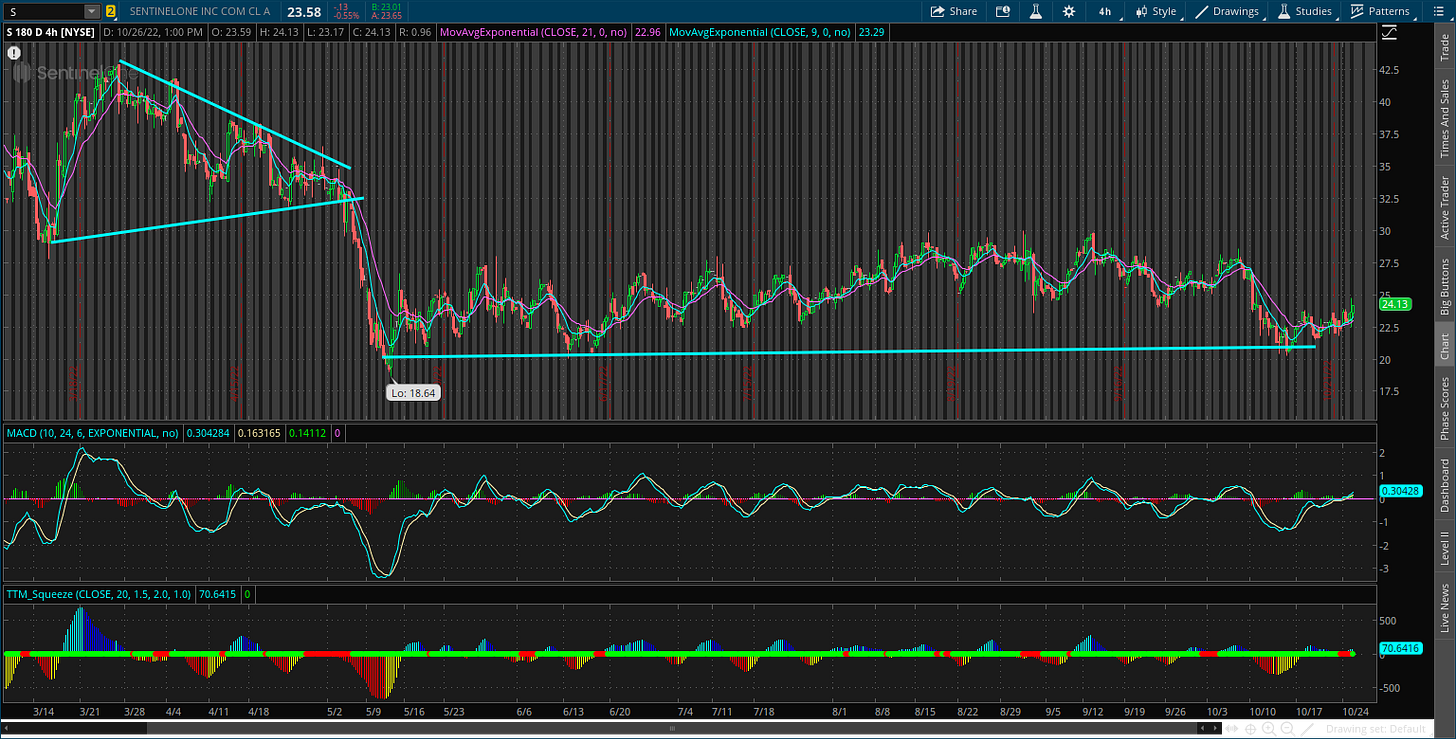
Tested the $20-21 support level several times since May. Basing period setting up the next move lower on a breakdown of support.
U
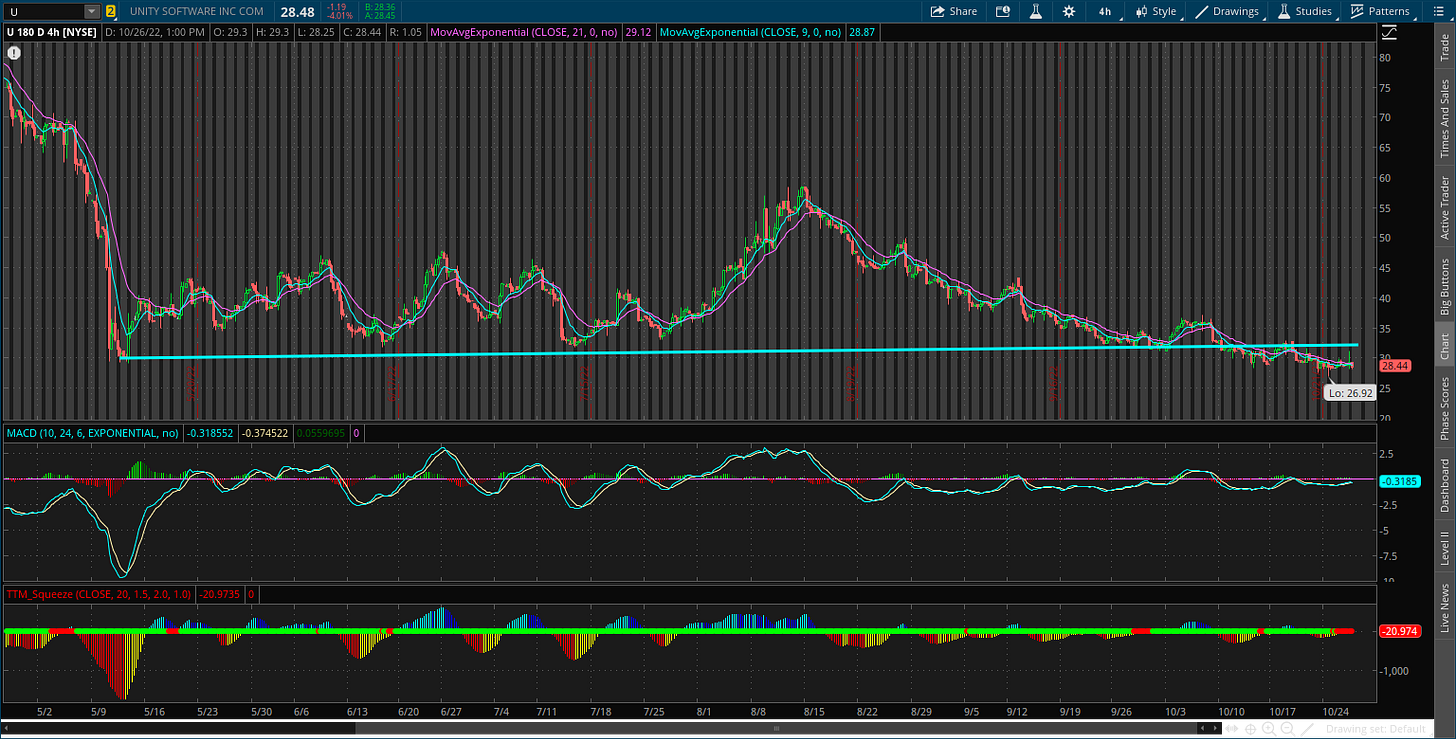
Stock broke the bigger trendline, then back tested that resistance level. Now starting to break below the $30 trigger level.
FVRR
Found support around $29 in May and has tested that level several times since then. Finally broke lower this past week and tested the break down level.
Rules of the Game
If you haven’t noticed yet, I trade breakouts! I trade based on the daily chart for long positions. And for price triggers on long setups, I tend to wait until the last half hour of trading to add a position. I find that emotional money trades the open, and smart money trades the close. If it looks like a stock is breaking out, I don’t want a “head fake” in the morning followed by a pullback later in the day.
Also for long positions, I use the 21-day exponential moving average (EMA) as a stop. If in the last half hour of trading it looks like a position will close under the 21-day EMA, I’m usually selling whether it’s to take a loss or book a profit.
For short (or put) positions, I trade off a four-hour chart instead of a daily. Why? There’s a saying that stocks go up on an escalator and down on an elevator. Once a profitable trade starts to become oversold on the four-hour MACD, I start to take gains. Nothing like a short-covering rally to see your gains evaporate quickly, so I’m more proactive taking profits on short positions. I also use a 21-period EMA on the four-hour chart as a stop. If there is a close above the 21-period EMA, I will cover my short.
For updated charts, market analysis, and other trade ideas, give me a follow on twitter: @mosaicassetco
Disclaimer: these are not recommendations and just my thoughts and opinions…do your own due diligence! I may hold a position in the securities mentioned in this newsletter.


