

In this post, I’ll focus on setups that I’m monitoring for both long and short positions. With a chart and short write-up, this is a quick way to scan and plan potential trades.
These ideas are the end result of my process to identify stocks offering the right combination of growth fundamentals along with a proper chart setup. Live alerts are sent to Traders Hub members only.
Stock Market Update
The stock market is having one of its strongest periods in history, with the S&P 500 up 10.7% over the past 11 trading sessions. It ranks as the fifth quickest recovery to record highs following a deep pullback. The S&P closed firmly above the 7,000 level for the first time in history despite the ongoing uncertainty in the Middle East that sparked a 9% drawdown in the index into late March. I’ve argued that bullish conditions for a rally formed after a key group of institutional investors (CTAs and risk-parity) built up extremely bearish positions. What you’re seeing now is a positive feedback loop as improving momentum and falling volatility draws fund flows back into the market.
But there are reasons to be skeptical about the durability and longevity of current rally. One has to do with seasonal trends, where a period of bullish seasonal tailwinds peaks later this month and doesn’t resume until July based on the past 20 years of calendar returns. A drawdown could be more pronounced if the presidential cycle continues tracking in the chart below. You can see that the S&P 500 tends to find its peak about now ahead of mid-term elections, and then recovering during the final quarter of the year.

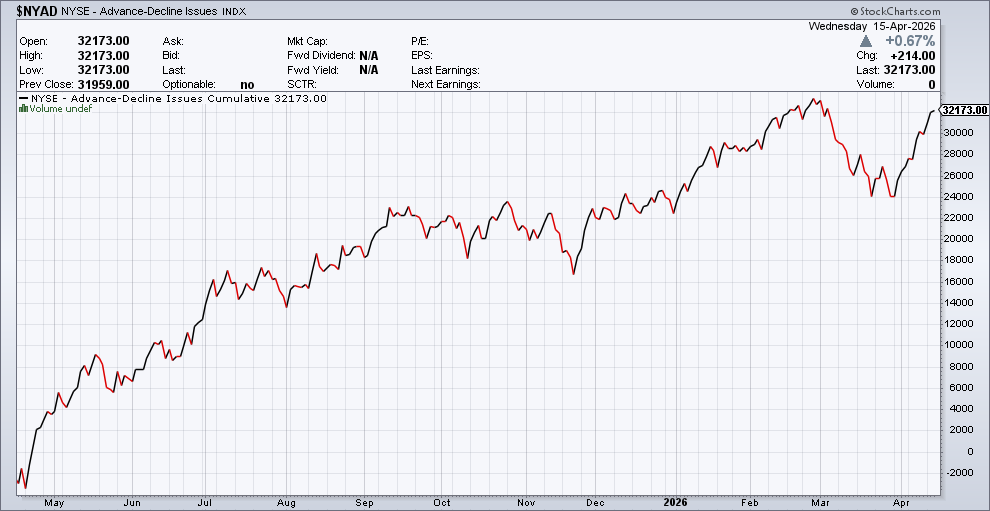
I would not base any investment decision or outlook based on seasonals alone, which is why I’m also watching confirmation from breadth. I’ve previously noted to Hub members that advance/decline stats coming off the late March low have been lackluster and failed to trigger any meaningful breadth thrust metrics despite the sharp gains. Participation by the average stock is also lagging the indexes on the rebound. The equal-weight S&P 500 remains below its record high and is not confirming the cap-weighted S&P’s new record. The NYSE advance-decline line in the chart below is another way to track the performance of the average stock. It’s also failing to confirm the new high in the S&P.
The breadth divergences noted above are short-term in nature at this point and the average stock could catch up in the days/weeks ahead. But it’s worth noting especially as seasonal tailwinds go away and I’ve noted the absence of high quality setups, which is a big change coming off the lows in April last year. We’re still adding a couple new positions over the past week, but will continue being very selective in our chart setups.
Keep reading to see:
Open ETF positions.
Open stock positions.
Chart analysis for new trade ideas.
