Mosaic Chart Alerts
Forget the Fed. Follow the message from these key sectors instead.
Welcome back to Mosaic Chart Alerts!
In this newsletter, I’ll focus on the best setups that I’m monitoring for both long and short positions. With a chart and short write-up, this is a quick way to scan and plan potential trades.
These ideas are the end result of my process to identify stocks offering the right combination of fundamentals along with a proper chart setup.
Here are my notes from a shortlist of setups I’m monitoring.
Stock Market Update
While investor attention is focused squarely on the Federal Reserve meeting this week, the most important developments are those taking place under the stock market’s hood. I frequently discuss breadth, and the strong participation behind this year’s stock market rally. I also highlighted in last week’s Market Mosaic how longer-term measures are turning positive, including one that bottomed back in June and is still leading the way.
But in addition to breadth, I like to confirm the market’s trend by looking at the leaders. In 2022, consumer staple stocks were among those leading the way. That’s not exactly bull market material when defensive groups are outperforming. Instead, you want to see cyclical sectors pulling the market ahead, which signals better times for the economy. Last week, I discussed the positive signs coming from semiconductor stocks, where SMH was breaking out over the 200-day moving average (MA) well before the S&P 500 got there. Now small-caps are showing relative strength, with the IWM small-cap ETF taking out $188 resistance that stretches back to November. And the next sector I’m monitoring is with transportation stocks. The post below shows the level I’m watching with the IYT transportation ETF:
Leadership from various cyclical areas are helping sustain the stock market’s momentum, which also means our long breakout setups are working. We’re seeing chart setups complete with MRC and TRI, so I’m removing those names from the watchlist. I’m also taking WTTR off watch for now. I recently described the setup in WTTR in more detail, but the pattern never completed and price is now moving below key moving averages. I’m making room on the watchlist for better setups, and will put WTTR back on if relative strength improves. The rally in growth stocks is also invalidating the patterns in NET and SNOW on the short watchlist, so those are being removed as well. The turnover means there are several new additions to this week’s list. Also please note that several watchlist stocks report earnings this week!
Keep reading below for all the updates…
Long Trade Setups
MCHP
Semiconductor stock with a couple resistance levels to note. First is the $80 level which is being taken out today. A move above would set up a test of the prior high just below $89.
HUBG
Transportation stock in the process of breaking out from this ascending triangle pattern. Resistance around the $86-$87 level is being taken out in today’s trading.
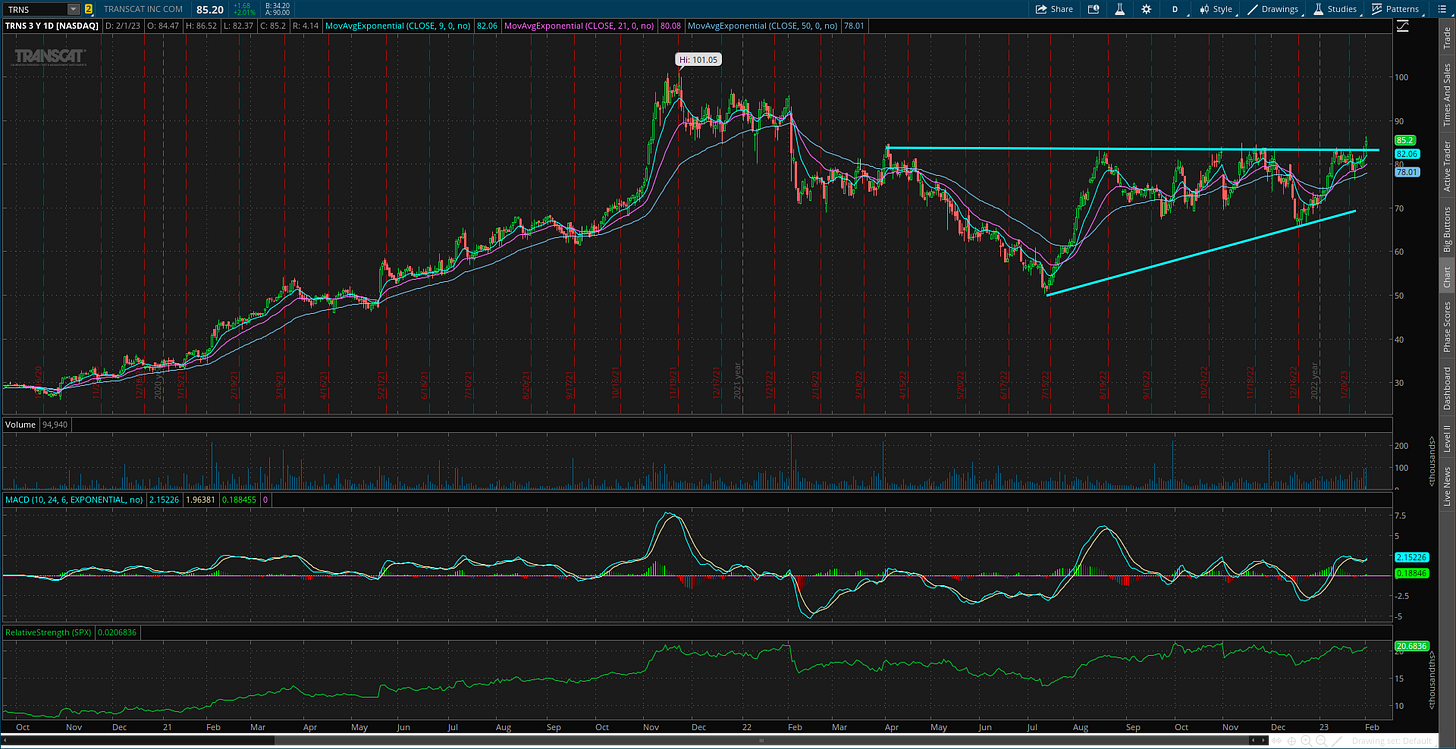
TRNS
Taking out the $85 level in trading today, while the recent move higher is also occurring on better volume. Setting up a test of the prior high at $100.
SNA
Simple basing pattern stretching back to 2021. Recent test of the $250 resistance level was turned back, but allowed the MACD to reset and now turning higher again on a potential breakout.
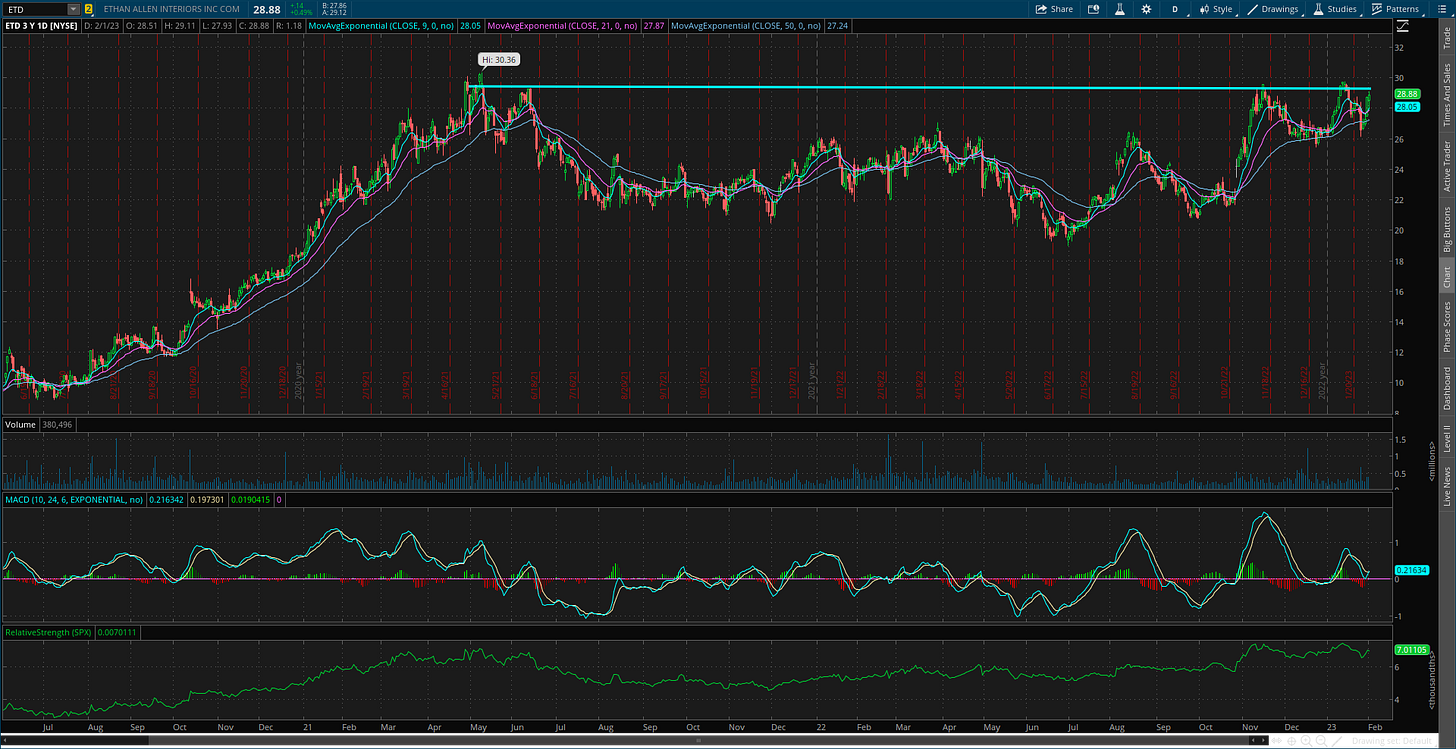
ETD
Noted last week that the recent rejection off $30 resistance could help the breakout setup by resetting the MACD, which is exactly what happened. Still watching for a move over $30.
RNGR
Price resistance around the $11.50 level tested several times over the past 16 months. Still trading in a tight range just below that level. A more speculative smaller-cap name, so position size accordingly.
Short Trade Setups
SBOW
Creating a support level around $24 that’s being tested again. Recent reset of the MACD below the zero line and move lower in the relative strength line could see support give way this time.
EQT
Testing the $31 support level. Similar to SBOW, the MACD has reset at the zero line and relative strength is already breaking down to support a potential move lower.
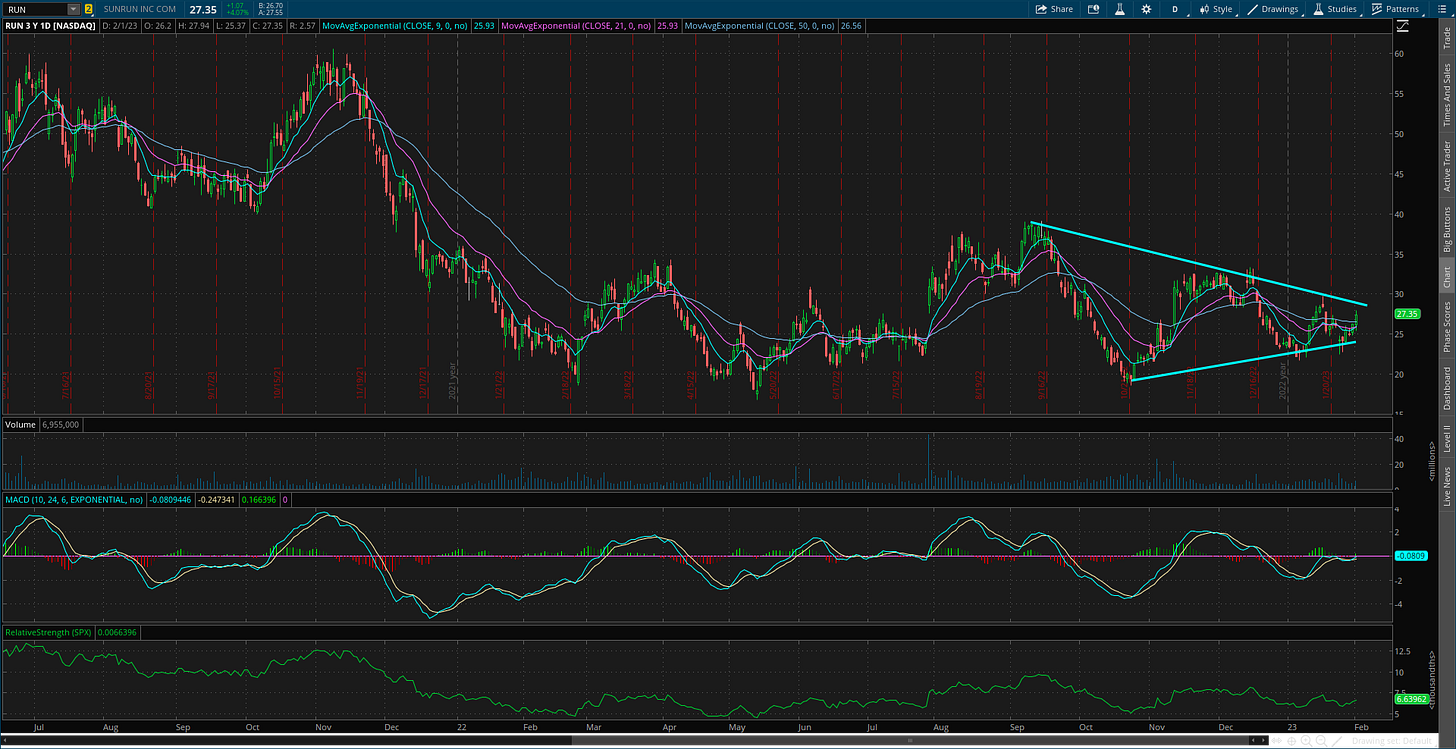
RUN
Creating a bearish triangle continuation pattern. Watching for a close below trendline support around the $23 level.
MOS
Abnormal price bar last week likely related to the NYSE’s technical “glitch”. Keeping on watch for another week. Want to see price move back below moving averages and MACD turn back lower to test support around the $43 level.
Rules of the Game
If you haven’t noticed yet, I trade breakouts! I trade based on the daily chart for long positions. And for price triggers on long setups, I tend to wait until the last half hour of trading to add a position. I find that emotional money trades the open, and smart money trades the close. If it looks like a stock is breaking out, I don’t want a “head fake” in the morning followed by a pullback later in the day.
Also for long positions, I use the 21-day exponential moving average (EMA) as a stop. If in the last half hour of trading it looks like a position will close under the 21-day EMA, I’m usually selling whether it’s to take a loss or book a profit.
For short (or put) positions, I trade off a four-hour chart instead of a daily. Why? There’s a saying that stocks go up on an escalator and down on an elevator. Once a profitable trade starts to become oversold on the four-hour MACD, I start to take gains. Nothing like a short-covering rally to see your gains evaporate quickly, so I’m more proactive taking profits on short positions. I also use a 21-period EMA on the four-hour chart as a stop. If there is a close above the 21-period EMA, I tend to cover my short.
For updated charts, market analysis, and other trade ideas, give me a follow on twitter: @mosaicassetco
Disclaimer: these are not recommendations and just my thoughts and opinions…do your own due diligence! I may hold a position in the securities mentioned in this newsletter.


