
Mosaic Chart Alerts
Forget about CPI. Focus on breadth and volatility for the stock market's next move.

Welcome back to Mosaic Chart Alerts!
In this newsletter, I’ll focus on the best setups that I’m monitoring for both long and short positions. With a chart and short write-up, this is a quick way to scan and plan potential trades.
These ideas are the end result of my process to identify stocks offering the right combination of fundamentals along with a proper chart setup.
Here are my notes from a shortlist of setups I’m monitoring.
Stock Market Update
Plenty of stock market fireworks are expected tomorrow when December’s consumer inflation report is released. There’s also plenty of fear that CPI could halt the market’s hot start to 2023, as the report became notorious for generating volatility. But I’m less concerned about this week’s economic reports and paying more attention to what’s happening under the market’s hood.
And to that end, breadth has been impressive to start the year. The percent of stocks above key moving averages, advance/decline ratios, and other breadth gauges are holding up remarkably well. I pointed out below that breadth metrics are starting to become overbought, but that doesn’t mean a decline is imminent. Instead, you should start watching for scenarios where the stock market’s rally is being supported by fewer stocks. We’re not seeing that just yet.

You should also pay close attention to how the Volatility Index (VIX) behaves following CPI. I discussed in The Market Mosaic how falling VIX levels can draw institutional fund flows back into equities. The chart below shows a critical support level is back in play for the fourth time in this bear market. A sustained move below support could keep the rally intact.

I’m also encouraged by an expanding number of stocks on my watchlist that are creating solid breakout patterns. I have several new additions this week as a result. I’m also removing several names from the watchlist, including OI and SCHW that have broken out and completed their pattern. I’m also removing NSP, which never triggered a trade and there are better opportunities becoming available. There’s also not much playing out on the short watchlist, where I’m removing W as price strength invalidates the setup we were tracking.
Keep reading below for all the updates…
Long Trade Setups
TEX
Tested the $45 resistance level and breaking out today on strong volume. Targeting a test of the prior highs around $55.

ETD
Strong move off the October lows quickly brought the stock back to the $30 resistance area. Pullback reset the MACD with momentum picking back up to attempt a breakout.

LSCC
Showing the weekly chart here as it highlights the resistance levels better. Watching for a move over the $74 area. Similar to other setups discussed, the daily MACD has reset following a test of that level.

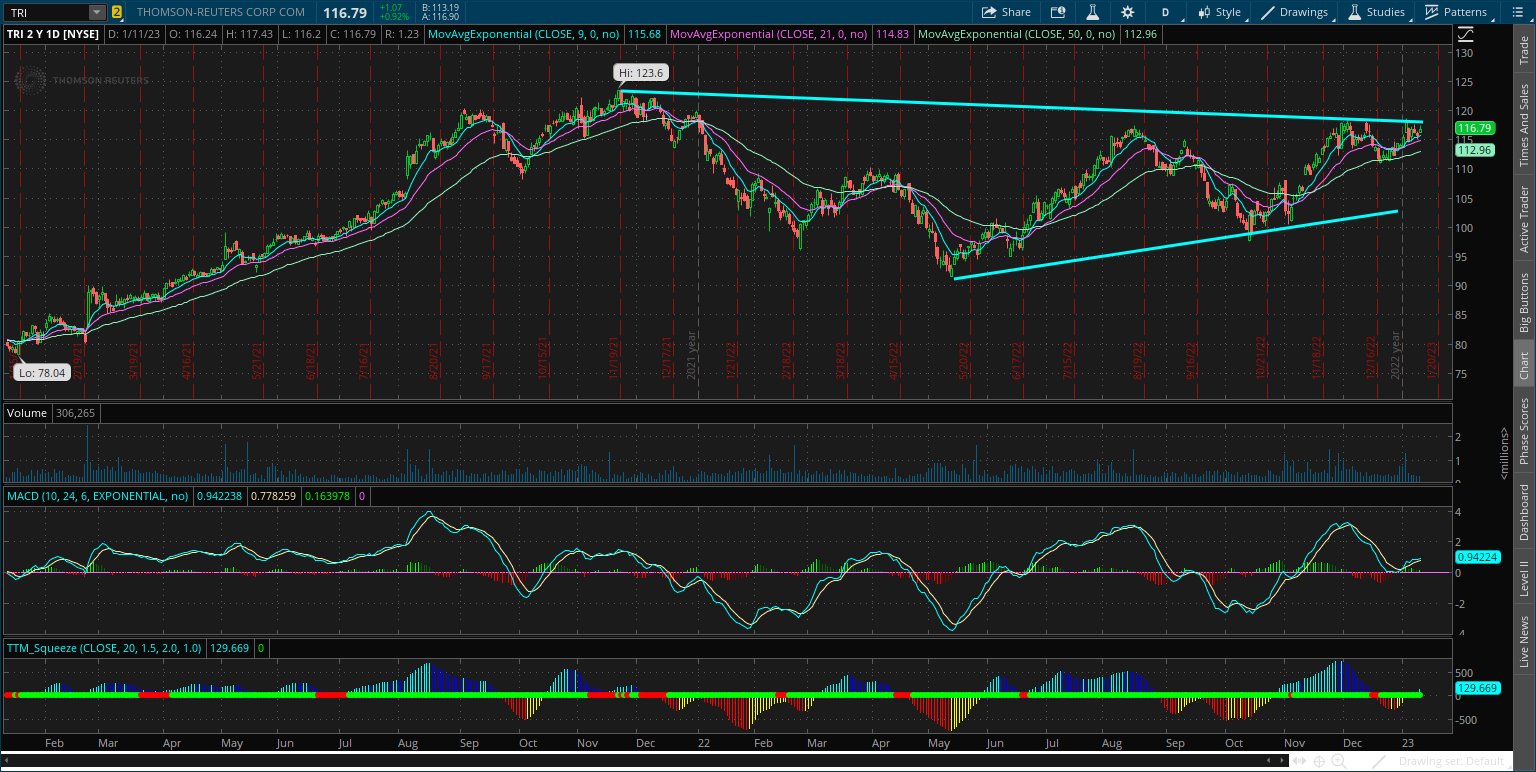
TRI
Trendlines show a triangle consolidation pattern. Price still right at trendline resistance with the MACD turning higher.
KLXE
Turned away last week at the $19 resistance level. But stock held the 50-day MA, and the MACD is still in a position to support a breakout.

RNGR
Price resistance around the $11.50 level tested several times over the past 16 months. Still trading in a tight range just below that level. A more speculative smaller-cap name, so position size accordingly.

Short Trade Setups
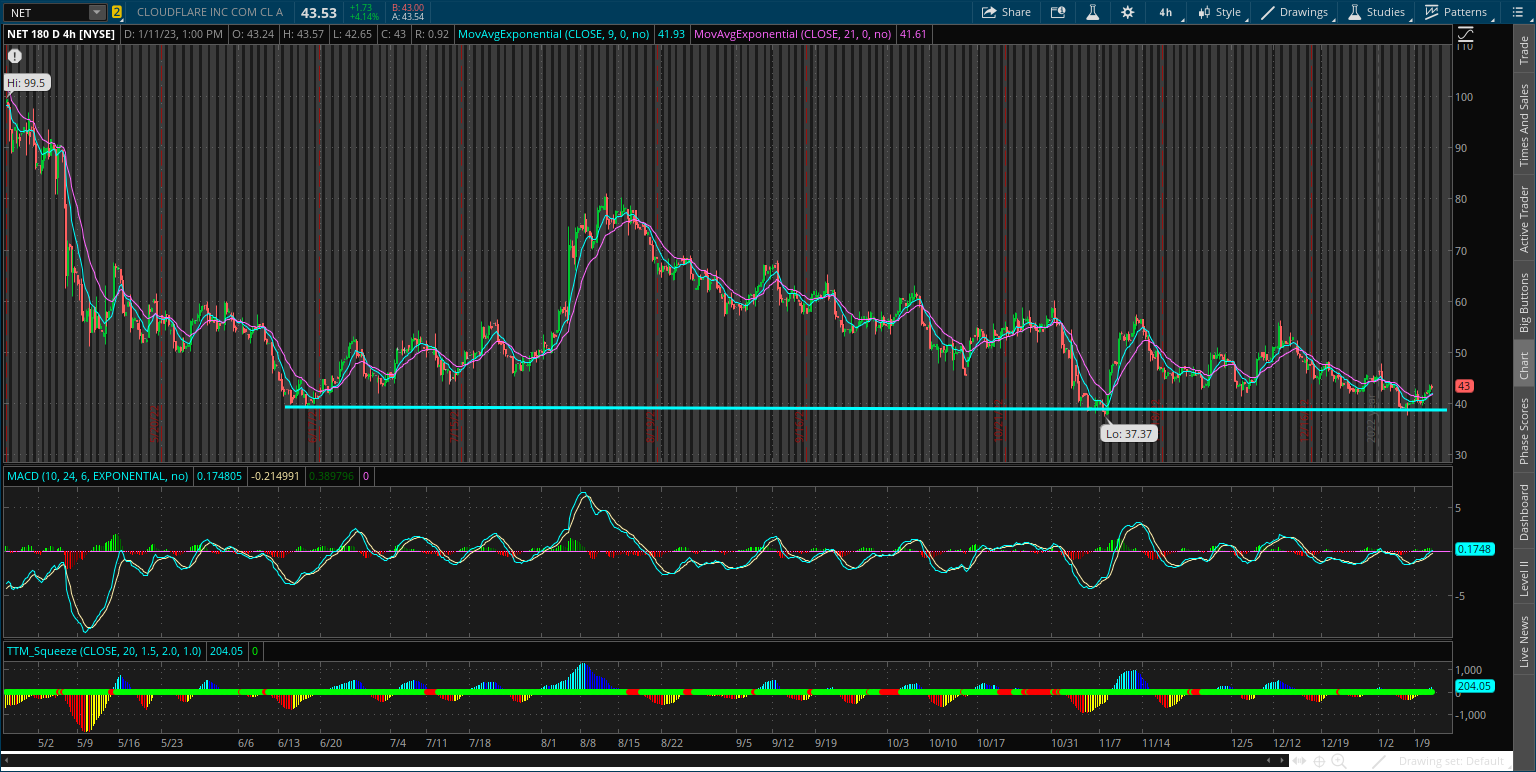
NET
Bouncing off the $40 support level for the third time since June. Simple setup and trigger level.
TTD
The $40 support level tested several times since May is still in play. Using a close below as a trigger level.

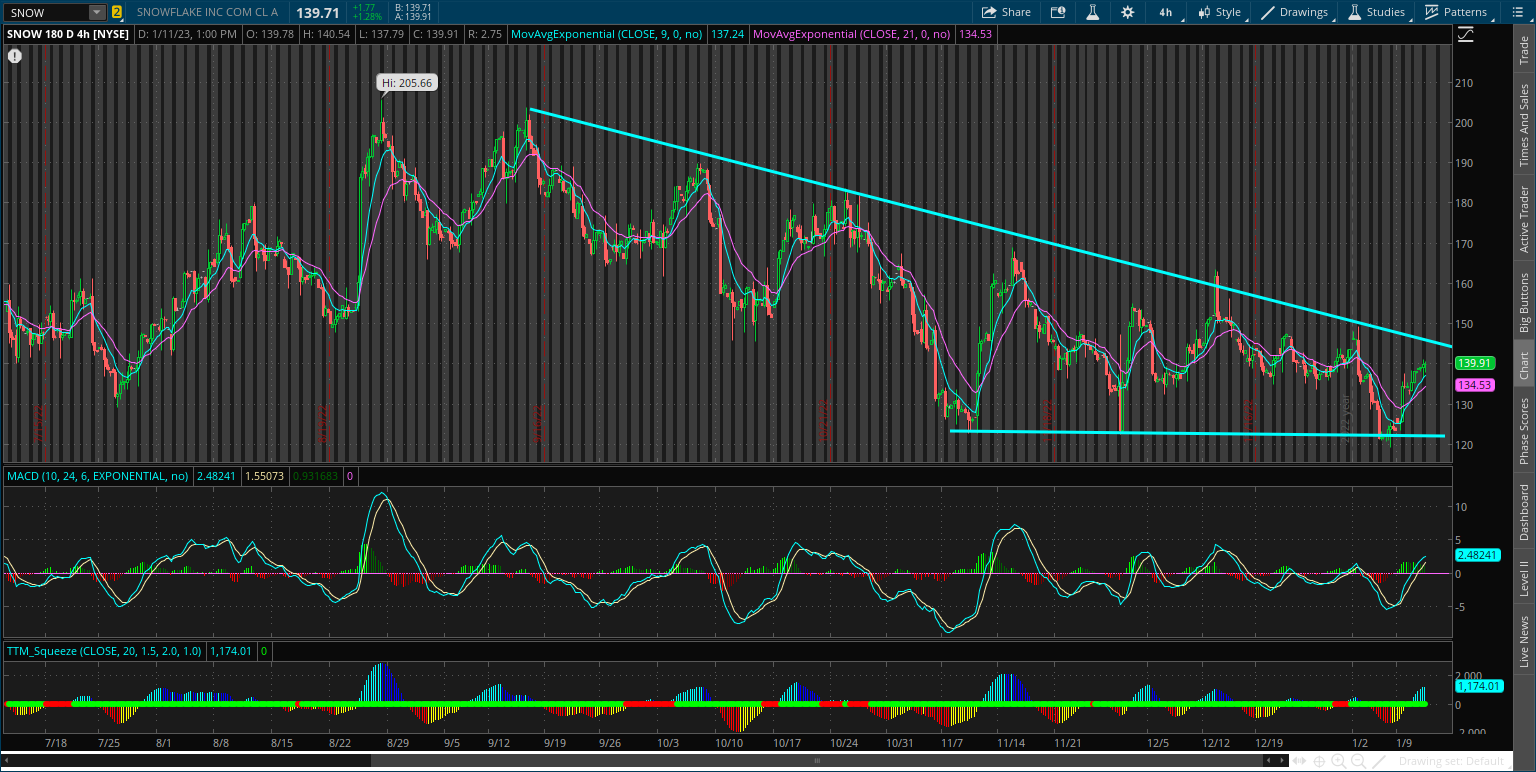
SNOW
Changing this setup from last week. Now watching for a breakdown through the $121 support area.
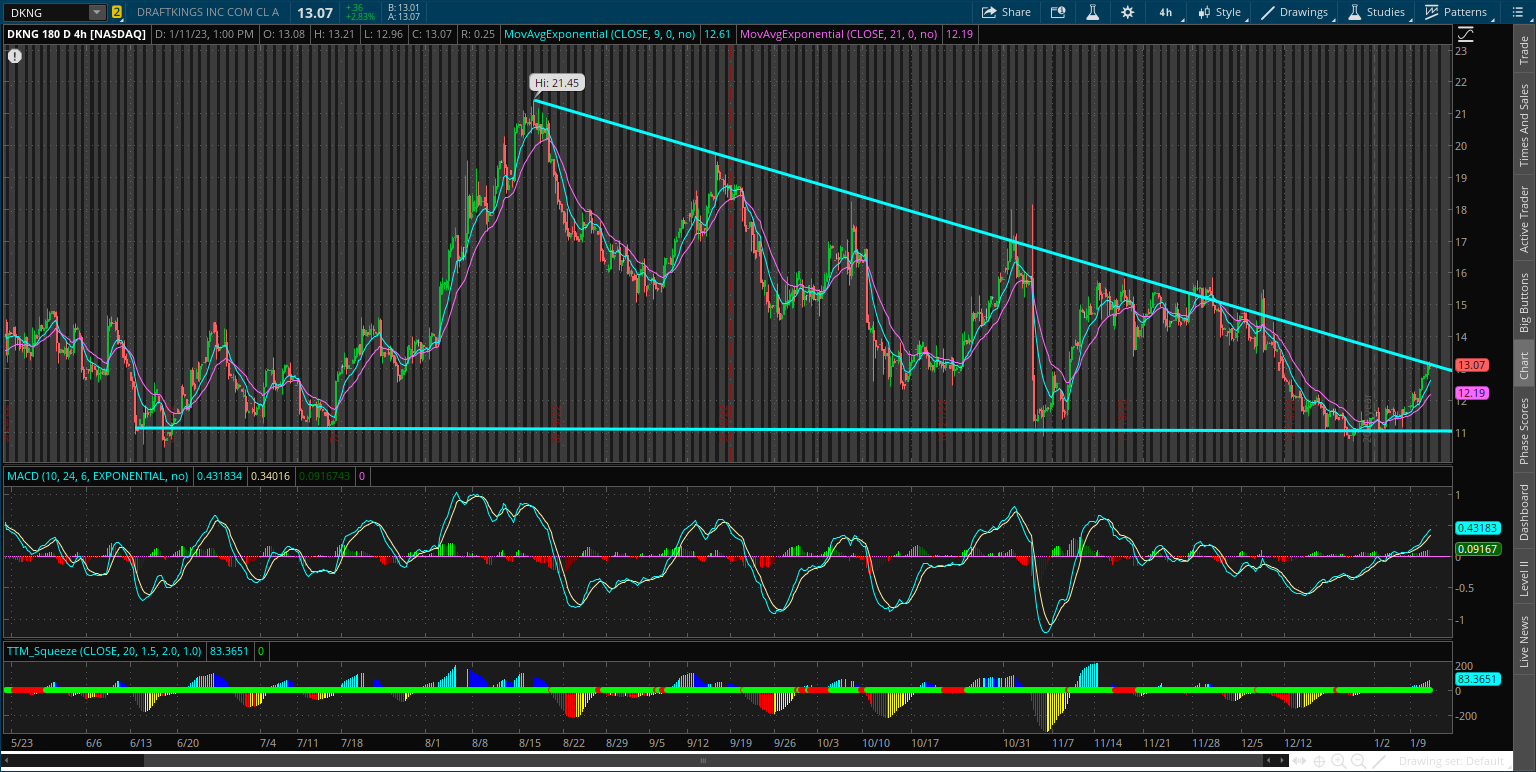
DKNG
This descending triangle pattern remains in play. Right back to trendline resistance again. Still watching for a break below $11 support.
Rules of the Game
If you haven’t noticed yet, I trade breakouts! I trade based on the daily chart for long positions. And for price triggers on long setups, I tend to wait until the last half hour of trading to add a position. I find that emotional money trades the open, and smart money trades the close. If it looks like a stock is breaking out, I don’t want a “head fake” in the morning followed by a pullback later in the day.
Also for long positions, I use the 21-day exponential moving average (EMA) as a stop. If in the last half hour of trading it looks like a position will close under the 21-day EMA, I’m usually selling whether it’s to take a loss or book a profit.
For short (or put) positions, I trade off a four-hour chart instead of a daily. Why? There’s a saying that stocks go up on an escalator and down on an elevator. Once a profitable trade starts to become oversold on the four-hour MACD, I start to take gains. Nothing like a short-covering rally to see your gains evaporate quickly, so I’m more proactive taking profits on short positions. I also use a 21-period EMA on the four-hour chart as a stop. If there is a close above the 21-period EMA, I tend to cover my short.
For updated charts, market analysis, and other trade ideas, give me a follow on twitter: @mosaicassetco
Disclaimer: these are not recommendations and just my thoughts and opinions…do your own due diligence! I may hold a position in the securities mentioned in this newsletter.
Thanks. Great work on those crypto related stocks.