

Welcome back to Mosaic Chart Alerts!
In this post, I’ll focus on setups that I’m monitoring for both long and short positions. With a chart and short write-up, this is a quick way to scan and plan potential trades.
These ideas are the end result of my process to identify stocks offering the right combination of fundamentals along with a proper chart setup.
Here are my notes from a focus list of setups I’m monitoring.
Stock Market Update
The latest report on consumer price inflation had something for bulls and bears alike. Coming in at 3.7% in August compared to last year, the Consumer Price Index (CPI) rose more than economists expected largely due to a big jump in gas prices. That also marks the second straight month that CPI’s yearly gain has ticked higher. But core CPI was up 4.3%, continuing a trend of moderating increases over the past year. If you take the core CPI over the past three months and annualize the figure, it comes in at just 2.4% (see the chart below from The Wall Street Journal). In the wake of the updated inflation figures, market implied odds suggest a 97% chance that the Federal Reserve holds interest rates steady at their meeting next week.

Despite all the anticipation and volatility around economic reports like the CPI, I find it much more conducive to study stock market trend, breadth, and sentiment to help inform my trade plan. To that end, the market feels stuck in neutral for much of the past month. After peaking in late July, the S&P 500 pulled back 5% into mid-August but is trying to grind higher since then (chart below). Right now the index is chopping around the 50-day moving average (black line), while the relative strength index (RSI) in the bottom panel could provide clues on the short-term direction. A move in the RSI above 60 or below 50 could help confirm the next swing in the S&P 500.

Shorter-term breadth started improving in late August but has stalled out recently, while investor sentiment appears balanced among fear and greed overall. September is also a poor month for calendar seasonality as I wrote in last week’s Market Mosaic. My take is that stocks are still digesting year-to-date gains while battling poor seasonals, but I still believe the market can resume the rally especially if this year’s leading sectors like semiconductors (chart below) can start to breakout.

Fresh breakouts are still harder to find, but there are corners of the stock market working its way higher. Relative strength has recently been focused in the energy sector, which I previously highlighted in more detail here. I’m taking the CRAK oil refining ETF off watch as our breakout setup completes. I’m also taking COCO off the watchlist following its chart breakout on rising volume with the relative strength (RS) line confirming. That clears the way for a couple new additions this week.
Keep reading below for all the updates…
Long Trade Setups
LI
Recently tested the highs from 2020 around the $45 level then pulled back. That’s resetting the MACD while the RS line continues to hold up. Looking for a breakout over $45 on rising volume with the RS line at a new 52-week high.

GHM
Trading in a sideways range after a breakaway gap over the $14.50 resistance level. RS line holding near the highs while MACD resets. Now watching for the uptrend to resume with a breakout over $17.75.

EDU
After breaking out over $45 from a consolidation lasting six months, price is basing again just below the $59 level. MACD resetting at the zero line while the RS line holds near the high.

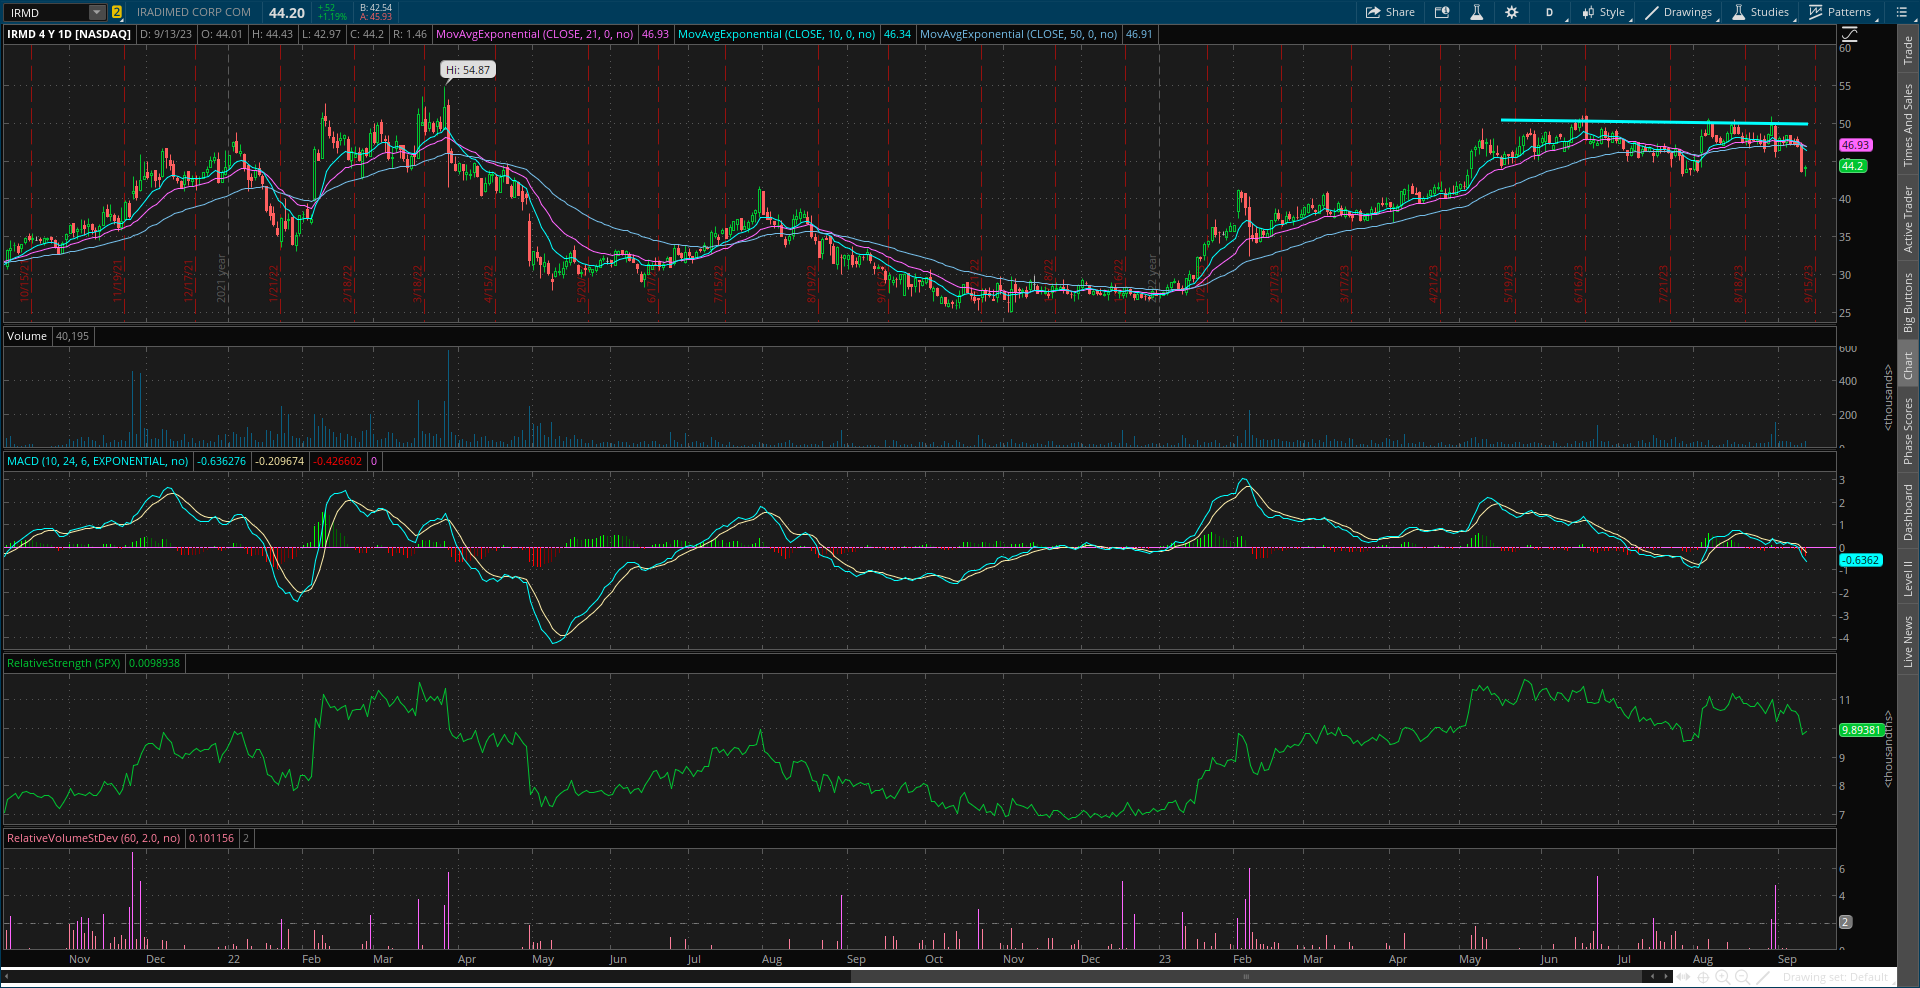
IRMD
Area of price resistance going back to last year coming into play. Disappointing price action this week, but will keep on watch as long as support around $43.50 holds. Watching for a breakout over $50 followed by a move to new highs.
BKR
Price rallying back to the highs made in early 2022, and now trading in a tight range for the past month. That recent consolidation has reset the MACD at the zero line. Stock is starting to breakout over the $37 level on increased volume.

BG
Recent rally came close to the highs made in early 2022. The pullback off that level making a bull flag pattern with the MACD resetting at the zero line. Watching for a move over $116 followed by a breakout to new highs. Want to see $110 hold on any pullback.

NVGS
Putting this stock back on the watchlist as price firms up and makes a run toward resistance around the $15 level. MACD in a good position to support a breakout, while I would like to see more improvement in the RS line.

TX
Consolidation base going back nearly two years. Watching for a move over $45, followed by a test of the prior highs around $52. Would prefer to see price support hold at the $40 level on the recent pullback.

Short Trade Setups
None this week!
Rules of the Game
I trade chart breakouts based on the daily chart for long positions. And for price triggers on long setups, I tend to wait until the last half hour of trading to add a position. I find that emotional money trades the open, and smart money trades the close. If it looks like a stock is breaking out, I don’t want a “head fake” in the morning followed by a pullback later in the day.
I also use the RS line as a breakout filter. I find this improves the quality of the price signal and helps prevent false breakouts. So if price is moving out of a chart pattern, I want to see the RS line (the green line in the bottom panel of my charts) at new 52-week highs. Conversely, I prefer an RS line making new 52-week lows for short setups.
Also for long positions, I use the 21-day exponential moving average (EMA) as a stop. If in the last half hour of trading it looks like a position will close under the 21-day EMA, I’m usually selling whether it’s to take a loss or book a profit.
For short (or put) positions, I trade off a four-hour chart instead of a daily. Why? There’s a saying that stocks go up on an escalator and down on an elevator. Once a profitable trade starts to become oversold on the four-hour MACD, I start to take gains. Nothing like a short-covering rally to see your gains evaporate quickly, so I’m more proactive taking profits on short positions. I also use a 21-period EMA on the four-hour chart as a stop. If there is a close above the 21-period EMA, I tend to cover my short.
For updated charts, market analysis, and other trade ideas, give me a follow on Twitter: @mosaicassetco
Disclaimer: these are not recommendations and just my thoughts and opinions…do your own due diligence! I may hold a position in the securities mentioned in this post.