Welcome back to Mosaic Chart Alerts!
In this post, I’ll focus on setups that I’m monitoring for both long and short positions. With a chart and short write-up, this is a quick way to scan and plan potential trades.
These ideas are the end result of my process to identify stocks offering the right combination of fundamentals along with a proper chart setup.
Here are my notes from a focus list of setups I’m monitoring.
Stock Market Update
Investors are enjoying the relief of a light economic calendar this week. But while there aren’t as many volatility-inducing headlines to contend with, you should still be paying attention to the message coming from the stock market’s cyclical sectors. And that message continues to be a positive one, marked by expanding upside participation across key economically-sensitive industries.
Earlier in the year, it was semiconductor stocks leading the way. Now you have homebuilding stocks breaking out to new highs, as you can see with the iShares US Home Construction ETF (ITB) below. Not only that, but industrial stocks are on the verge of making new highs as indicated by the XLI sector ETF, while I posted a note here about the favorable setup developing with transportation stocks (which are starting to breakout of the pattern today).
Another cyclical segment that I want to see join the party is with small-caps. The chart below shows the Russell 2000 Index ETF (IWM). After bouncing near the bear market lows since mid-March, small-caps have found traction and traded above the $180 resistance level shown with the dashed trendline. Over the past two weeks, smalls are consolidating those gains and testing the breakout level while the 50-day moving average (MA - black line) is close to crossing above the 200-day MA (green line). Ideally, IWM holds above $180 and key MA’s to start another leg higher over the $190 level.
Along with a sharp improvement in breadth at the beginning of June, the market environment remains much more constructive for trading breakouts. I’m still trailing several positions holding key moving averages, and monitoring the next round of setups. NOVT is breaking out to complete its pattern, so that stock comes off watch. I’m also removing NVGS and LTH to make room for better opportunities (those stocks never broke out, but could be added back to the watchlist). I’m also removing KEY from the short watchlist as the stock breaks down from its pattern
Keep reading below for all the updates…
Long Trade Setups
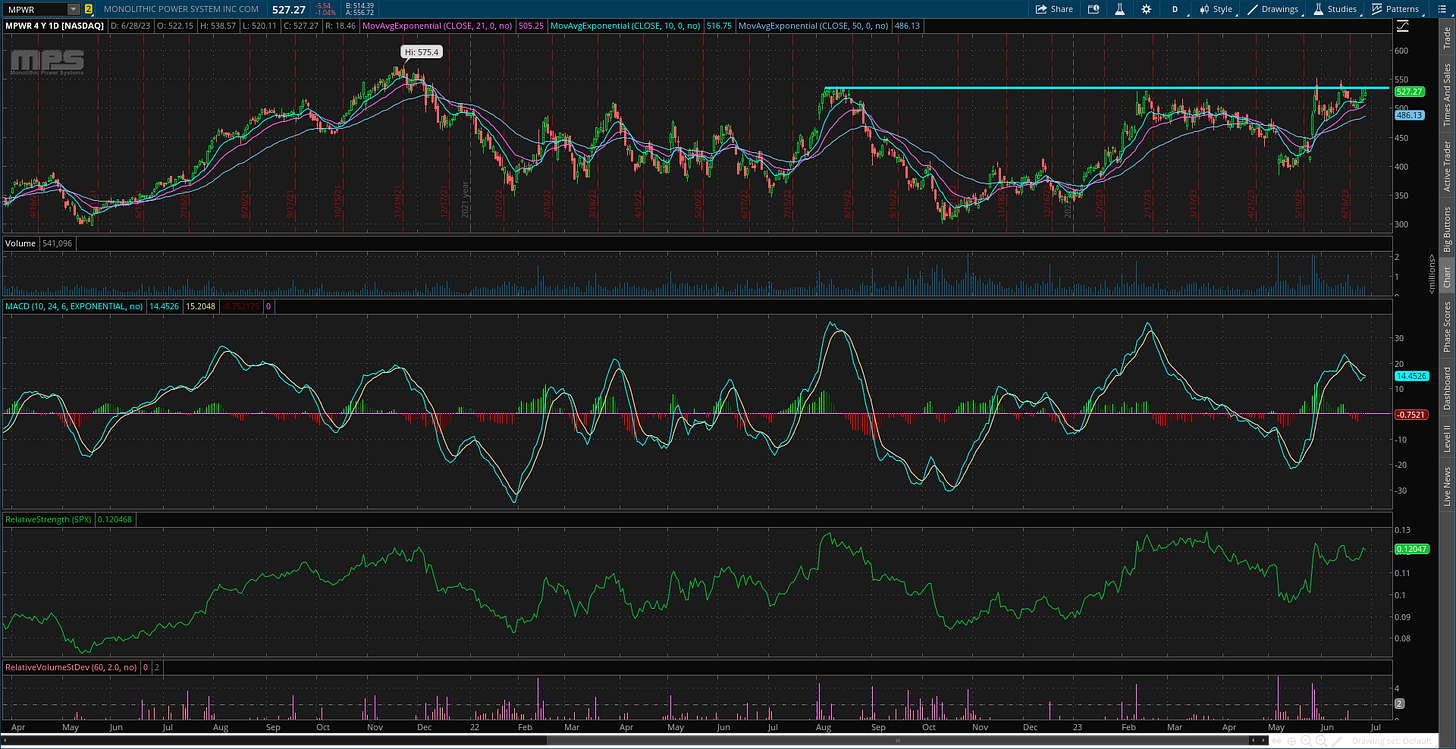
MPWR
Making a series of higher lows off the October bottom while finding resistance around the $540 level each time. A breakout over that level could target the prior highs around $570 for a bigger move.
CVLG
Highlighted this setup in this week’s Market Mosaic. Transport stock creating an ascending triangle pattern, which could also be a “base on a base”. Breaking out over $43.
FTI
Starting to emerge from an ascending triangle consolidation pattern with resistance around the $15.75 level. Prefer to see the relative strength (RS) line at new 52-week highs to confirm a breakout.
IESC
Stock is recently testing the prior highs from 2021, and now taking out that level around $55 in today’s trading. Would prefer the MACD closer to the zero line on the breakout, but worth noting the RS line is close to new highs.
IOT
There’s a lot of eyes on this stock, so I want to give my quick take and plan. Price rallied right back to the post-IPO highs around $30. With the recent pullback from that level, the MACD is resetting at the zero line with the RS line staying near the highs. A breakout over $30 with the RS line at a new high and the MACD turning up from zero is my ideal trade scenario.
NABL
Another recent IPO testing the prior highs around $15.50. Prefer to see the stock hold the $14 support level while it consolidates. Watching for a breakout over $15.50 with the RS line confirming to new highs.
SWAV
Price is currently consolidating after another test of the prior highs around $310. The MACD is staying near the zero while the RS line is holding near the highs. Impressive string of quarterly sales and earnings growth.
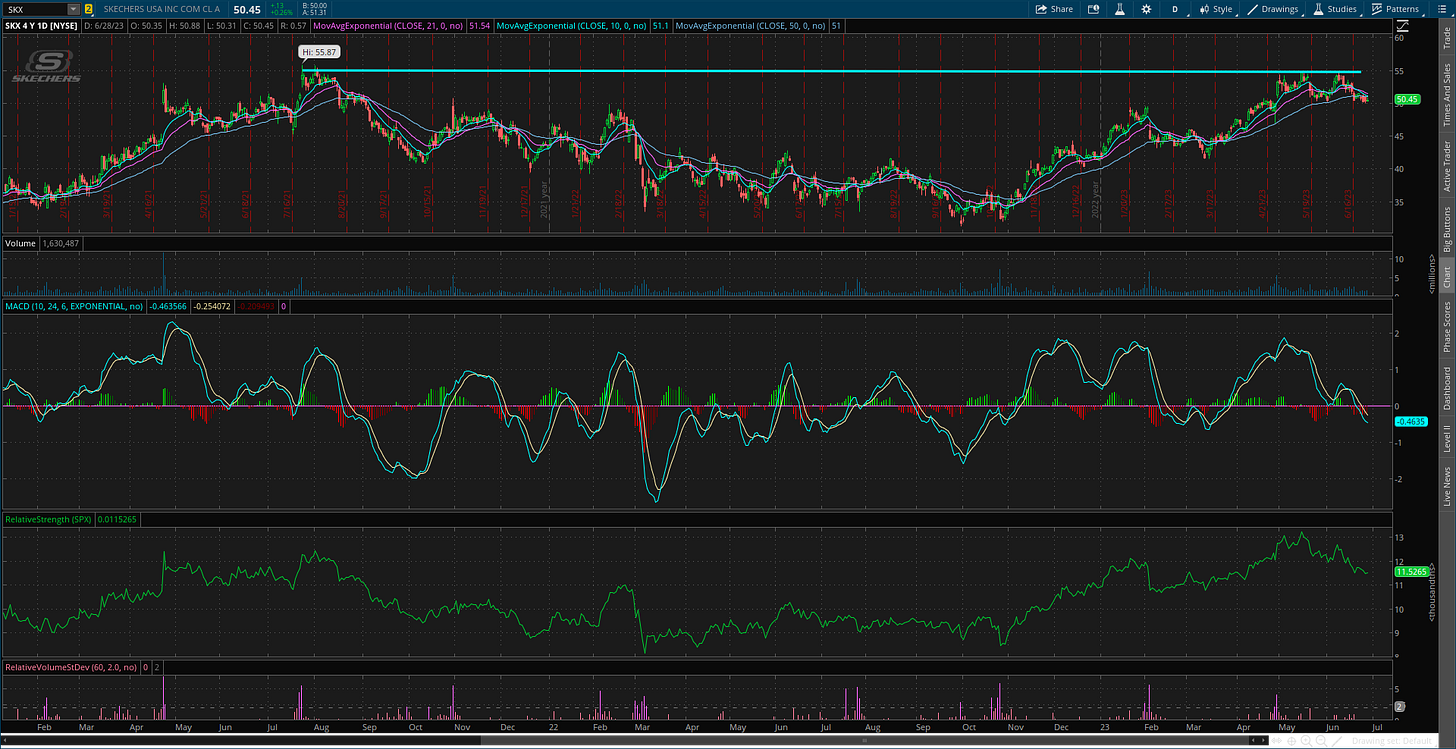
SKX
Tested the highs from 2021 at the $55 resistance level and pulled back toward the 50-day moving average. The $50 level is also good support from a prior breakout. Looking for a move to new highs, and don’t want to see $50 give way.
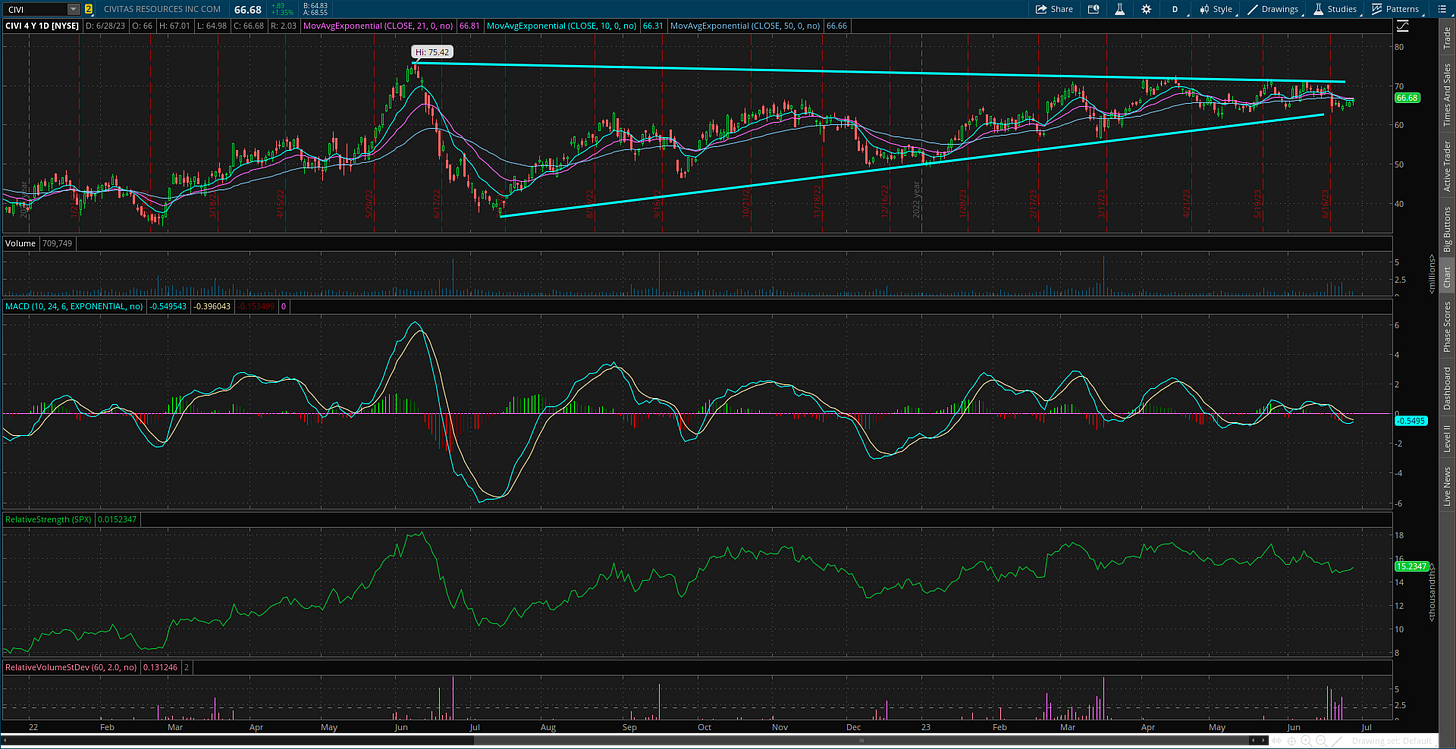
CIVI
Energy exploration and production company still trading inside this triangle pattern. Watching if price can move above the $72 level followed by new all-time highs.
Short Trade Setups
None this week!
Rules of the Game
I trade chart breakouts based on the daily chart for long positions. And for price triggers on long setups, I tend to wait until the last half hour of trading to add a position. I find that emotional money trades the open, and smart money trades the close. If it looks like a stock is breaking out, I don’t want a “head fake” in the morning followed by a pullback later in the day.
I also use the RS line as a breakout filter. I find this improves the quality of the price signal and helps prevent false breakouts. So if price is moving out of a chart pattern, I want to see the RS line (the green line in the bottom panel of my charts) at new 52-week highs. Conversely, I prefer an RS line making new 52-week lows for short setups.
Also for long positions, I use the 21-day exponential moving average (EMA) as a stop. If in the last half hour of trading it looks like a position will close under the 21-day EMA, I’m usually selling whether it’s to take a loss or book a profit.
For short (or put) positions, I trade off a four-hour chart instead of a daily. Why? There’s a saying that stocks go up on an escalator and down on an elevator. Once a profitable trade starts to become oversold on the four-hour MACD, I start to take gains. Nothing like a short-covering rally to see your gains evaporate quickly, so I’m more proactive taking profits on short positions. I also use a 21-period EMA on the four-hour chart as a stop. If there is a close above the 21-period EMA, I tend to cover my short.
For updated charts, market analysis, and other trade ideas, give me a follow on Twitter: @mosaicassetco
Disclaimer: these are not recommendations and just my thoughts and opinions…do your own due diligence! I may hold a position in the securities mentioned in this post.


