

In this post, I’ll focus on setups that I’m monitoring for both long and short positions. With a chart and short write-up, this is a quick way to scan and plan potential trades.
These ideas are the end result of my process to identify stocks offering the right combination of growth fundamentals along with a proper chart setup.
Stock Market Update
Signs of easing trade tensions and softer consumer inflation is driving the rally off the April lows even further. The U.S. and China announced a reduction in tariffs rates on each country’s imports for the next 90 days as negotiations for trade deal continue. The U.S. tariff on Chinese imports will fall to 30% for now, while China dropped its tariff rate on U.S. imports to 10%. While there are concerns around the impact of tariffs on the inflation outlook, the Consumer Price Index (CPI) came in lower than expected. The headline figure came in at 2.3% year-over-year for April, which is the lowest level since early 2021. The core figure that strips out food and energy increased by 2.8% which matched estimates. The chart below shows the annual rate of change in both the headline (dark blue) and core figure (light blue).

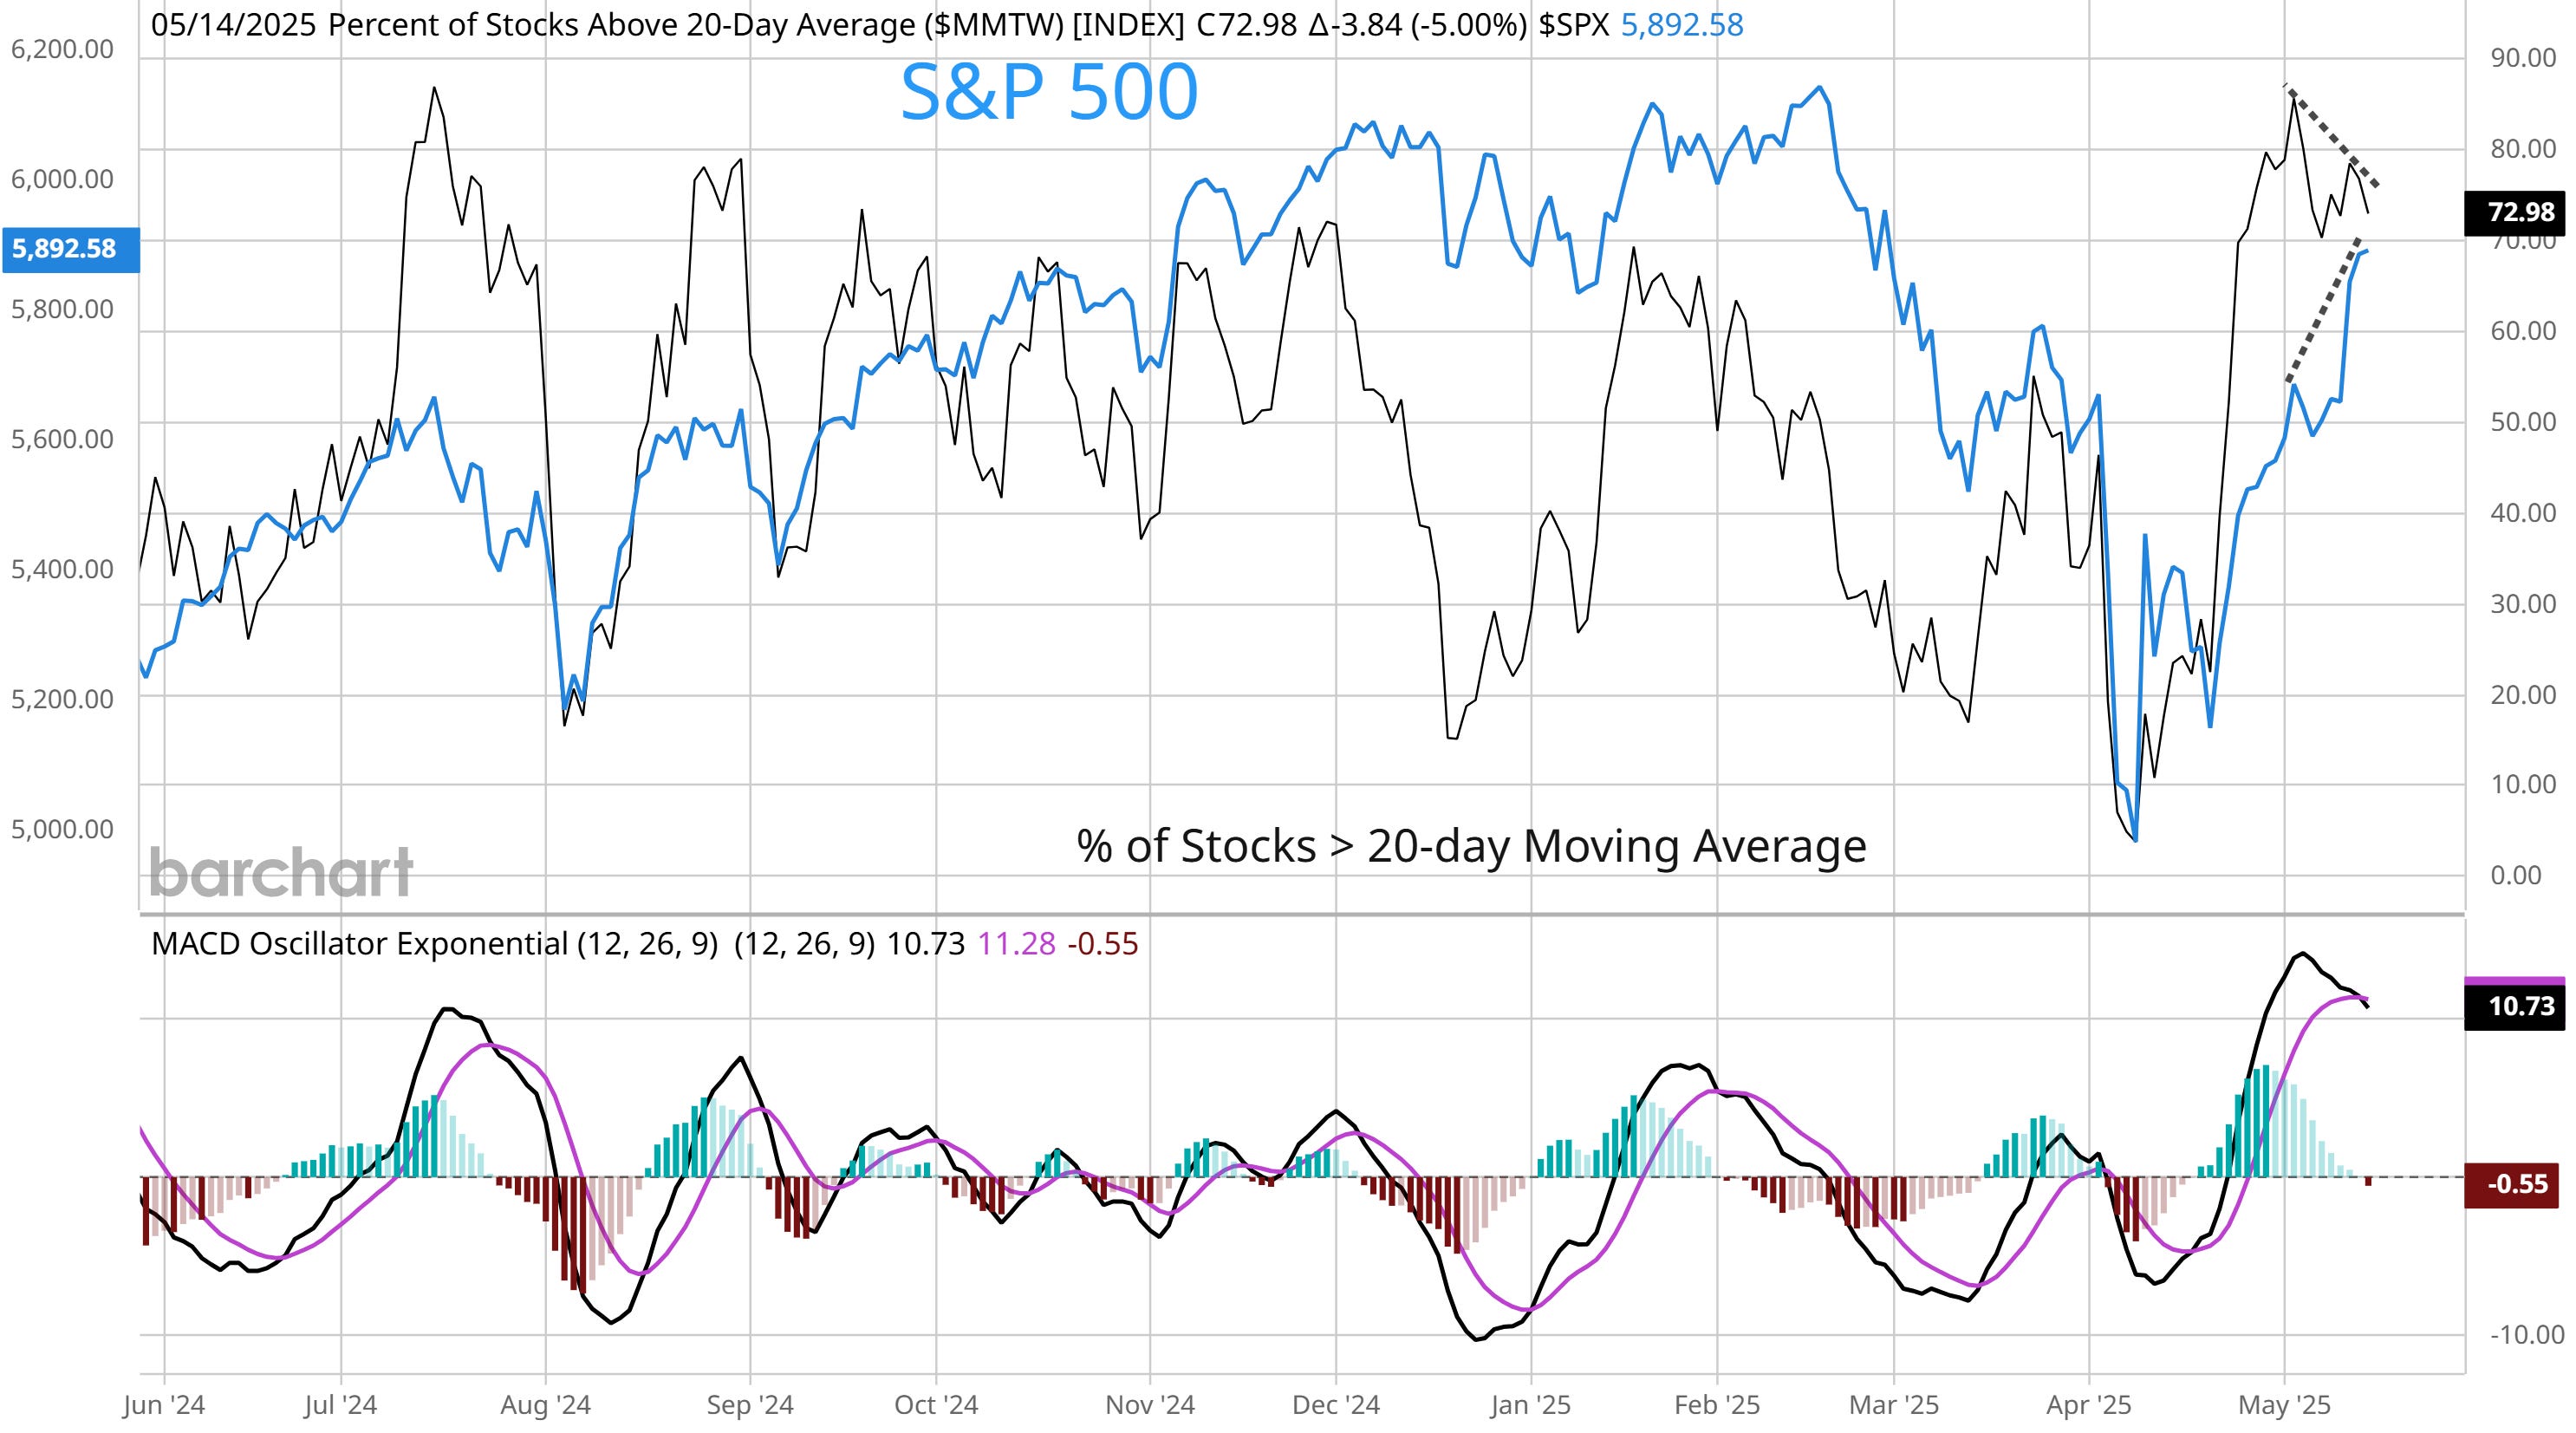
The rally in the S&P 500 is recovering key levels that I’ve recently highlighted. That includes price resistance around the 5790 area along with the 200-day moving average. But as stocks have surged off the April lows, several signs of exhaustion along with bearish conditions are emerging. Nearly 25% of stocks in the Nasdaq 100 Index have an RSI reading at 70 or higher, indicating the potential for mean-reversion lower. At the same time, a negative breadth divergence is developing with the percent of stocks trading above their 20-day moving average. The percent of stocks across the market in a short-term uptrend made a lower high as the S&P 500 has continued rallying (dashed lines in the chart below). Several signs of investor sentiment are also swinging back to showing too much bullishness, including CNN’s Fear & Greed Index that’s just below “extreme greed” territory.
Given bearish technical conditions and overbought signals, I wouldn’t be surprised to see the indexes pullback and consolidate the gains over the past month. But given the leadership in the average stock and breadth thrusts on the rally, I expect any pullback to be a pause in the broader uptrend.
Keep reading to see:
Open ETF positions.
Open stock positions.
Chart analysis for new trade ideas.
