

In this post, I’ll focus on setups that I’m monitoring for both long and short positions. With a chart and short write-up, this is a quick way to scan and plan potential trades.
These ideas are the end result of my process to identify stocks offering the right combination of growth fundamentals along with a proper chart setup.
Here are my notes from a focus list of setups I’m monitoring.
Stock Market Update
Three huge events will keep investors busy over the next week. While the election outcome will capture most of the attention, key macro economic events are lined up as well. This Friday features the payrolls report for the month of October, which comes on the heels of last month’s exceptionally strong figure. If more evidence points to a strong labor market, that could complicate how quickly the Federal Reserve can cut interest rates. With the central bank due to make a decision on rates next week, they will also consider the initial look at third quarter GDP that showed 2.8% annualized growth. The chart below shows that annual GDP growth has held above 2.5% for six quarters in a row, which is the longest streak in 18 years.

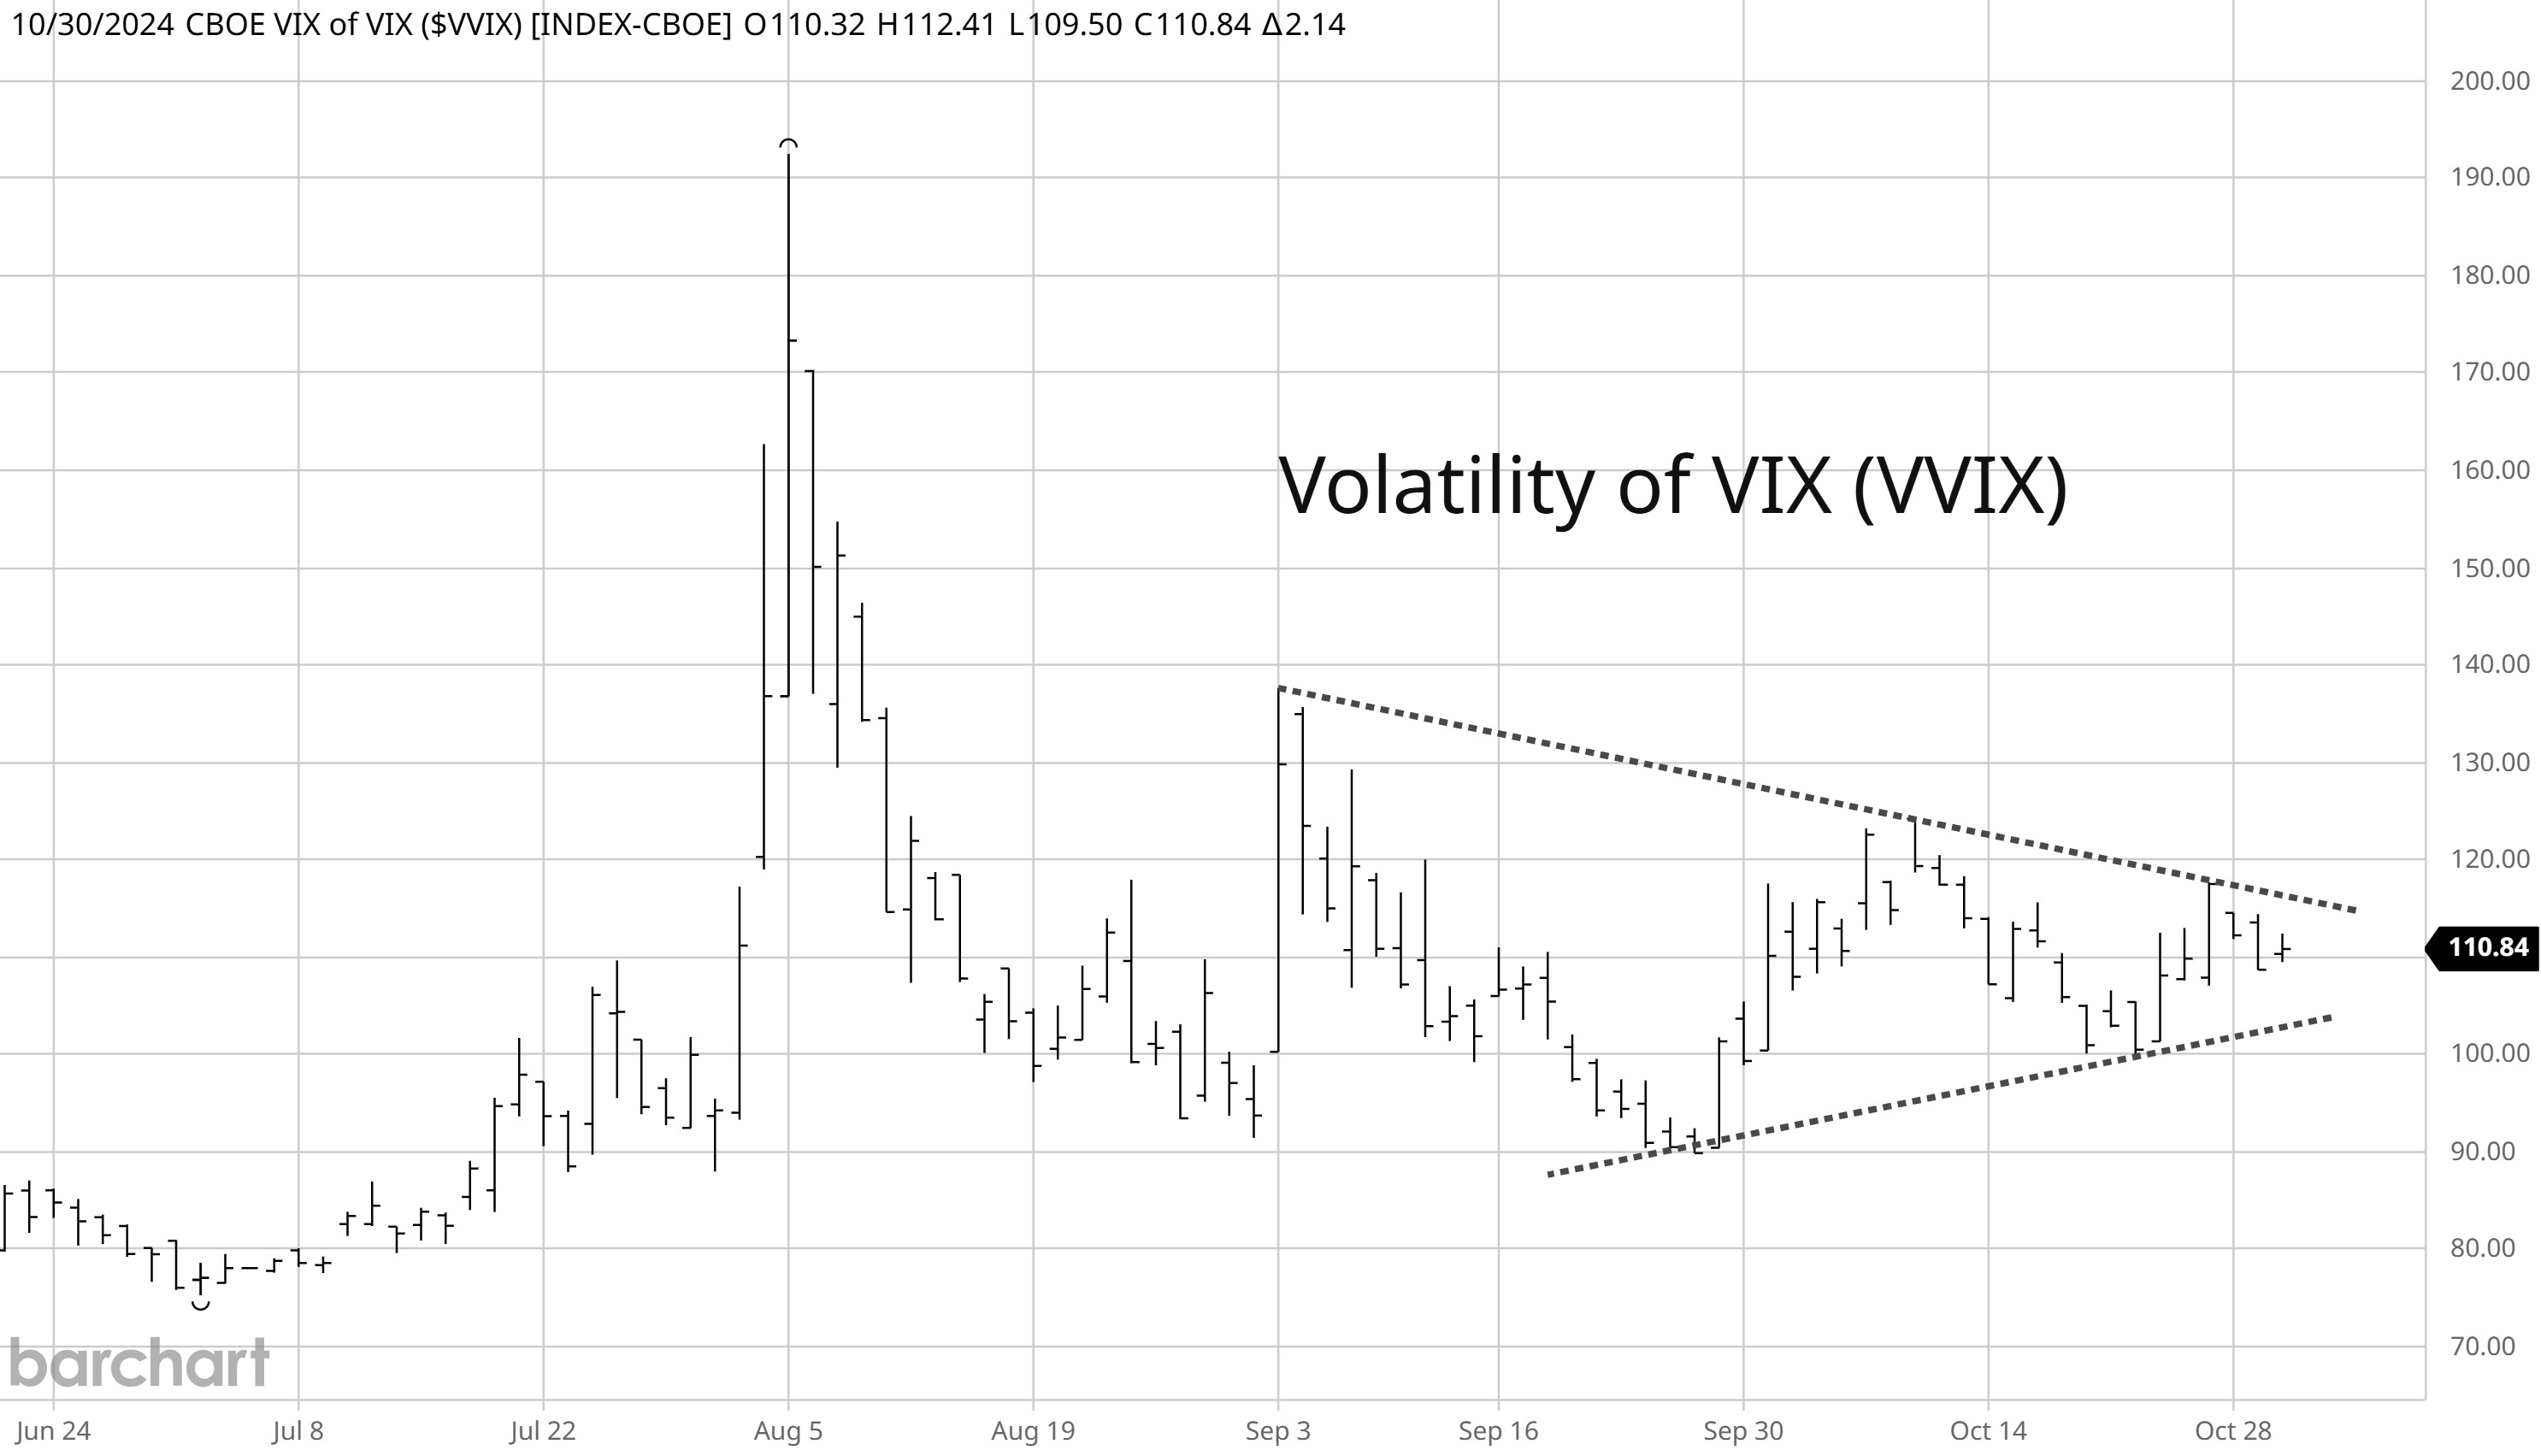
Instead of guessing how the stock market will ultimately respond to the extensive list of catalysts coming up, volatility markets are providing us with key levels to monitor. The CBOE Volatility Index (VIX) has stayed in a tight range for the past two weeks, and is hugging the long-term average just below 20. VIX has tested the 22 level twice since the start of September, where a move above would be a warning of a drawdown in equities. The “volatility of VIX” is also providing us with a pattern to track. Also called VVIX, it’s nearing the apex of an symmetrical triangle you can see in the chart below. A breakout or breakdown from the pattern could signal the next move volatility markets.
While there will be plenty of headlines to provoke knee-jerk reactions in stock prices over the coming week, perhaps the action in Bitcoin is already hinting at the next move in risk assets. As I posted here, Bitcoin’s weekly chart is emerging from a consolidation pattern going back to March while key momentum indicators are in the early stages of turning higher. Whatever transpires over the next week, my trading plan remains the same. I’m targeting stocks with strong growth fundamentals that are emerging from sound basing patterns. There are several changes and additions to the watchlist this week.
Keep reading below to see our Traders Hub model portfolio of open positions and chart analysis for new trade ideas.
Traders Hub Model Portfolio
