Welcome back to Mosaic Chart Alerts!
In this post, I’ll focus on setups that I’m monitoring for both long and short positions. With a chart and short write-up, this is a quick way to scan and plan potential trades.
These ideas are the end result of my process to identify stocks offering the right combination of fundamentals along with a proper chart setup.
Here are my notes from a focus list of setups I’m monitoring.
Stock Market Update
In prepared comments for his appearances on Capitol Hill this week, Federal Reserve Chair Jerome Powell reinforced the message that interest rate cuts are coming this year but not anytime soon. Powell specifically mentioned inflation “moving sustainably toward 2 percent” before cutting rates, and that the bigger risk is cutting too soon. In this week’s Market Mosaic, I highlighted the spread between the short-term fed funds rate and the yearly change in PCE inflation. Fed funds is above PCE by the largest margin since at least 2007. But despite the challenges posed by interest rates and restrictive monetary policy, big breakouts across different areas of the capital markets are holding up. In addition to recent strong performance from small-caps and cryptocurrencies, gold is now joining the party as well. I’ve discussed before that gold’s breakout already happened at the $2,000 per ounce level back in November (that’s clear on the monthly chart). After back testing that level as support several times over the past few months, gold is now moving out to new highs after breaking out from a bullish pennant pattern that you can see in the chart below.
The next chart to watch with major implications for everything from stocks to commodities is with the U.S. Dollar Index. Instead of a breakout, a breakdown from a developing “head and shoulders” continuation pattern could deliver another boost to risk assets. You can see in the chart below that after peaking in September 2022, the dollar fell into January 2023 but has since traded sideways. The more recent price action since last June shows the head and shoulders pattern, where a breakdown under 100 would be a significant loss of support. Among other things, a weak dollar makes foreign sales and earnings of U.S.-based companies worth more. That could especially be another tailwind for the technology sector that derives a relatively large share of revenues from international regions. And since many commodities are priced and traded in dollars, a weakening dollar increases the purchasing power of non-U.S. buyers.
As you would expect by the expanding number of sectors either moving to new highs or out of bottoming bases like with small-caps, this trading environment for breakouts is the best we’ve seen in nearly three years in my opinion. That’s evidenced by net new 52-week highs that have stayed in positive territory and is recently hitting levels not seen since late 2021. But with investor sentiment running at levels indicating too much greed, now’s the time to be on the lookout for breadth divergences to signal the potential for a pullback. For this week, I’m removing INTR, CELH, and ERJ from the watchlist as each stock is breaking out to complete their respective chart setups. That clears the way for a couple new additions this week.
Keep reading below for all the updates…
Long Trade Setups
NXT
After the gap higher through the $50 level, the stock has been trading sideways which is allowing the MACD to reset at the zero line. While the relative strength (RS) line is holding up near the highs, I would prefer to see more time basing before breaking over the $60 level to new highs.
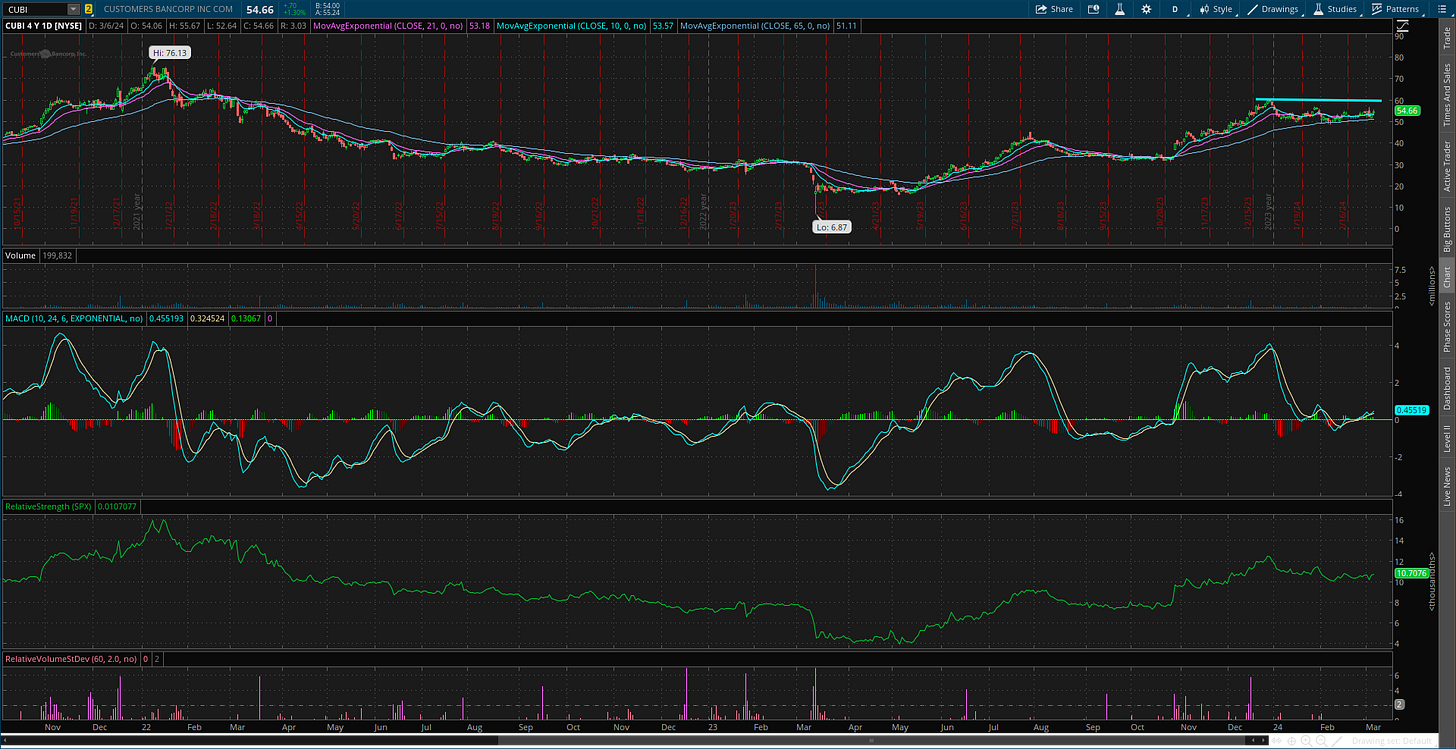
CUBI
Consolidating the gains after hitting $60 in late December. Would prefer to see the RS line take out the December peak on any breakout attempt. A move over $60 could target the prior high from the start of 2022.
CAVA
Recent IPO that’s trading near last year’s high around the $58 level. Volume has stayed high over the last several trading sessions while the MACD is just turning higher. Would prefer to see more sideways trading before attempting to breakout.
PATH
Attempting to emerge from a bottoming base going back nearly two years. Stock basing since December after breaking out over the $20 level. Don’t want to see support at $21 give way, which would invalidate the pattern. Watching for a move over $27.
STNE
Starting to emerge from a bottoming base going back two years. Took out resistance at $15 and now consolidating the gains. Trading sideways since late December, with a new resistance level near the $19 level. Want to see support at $16 hold in the pattern.
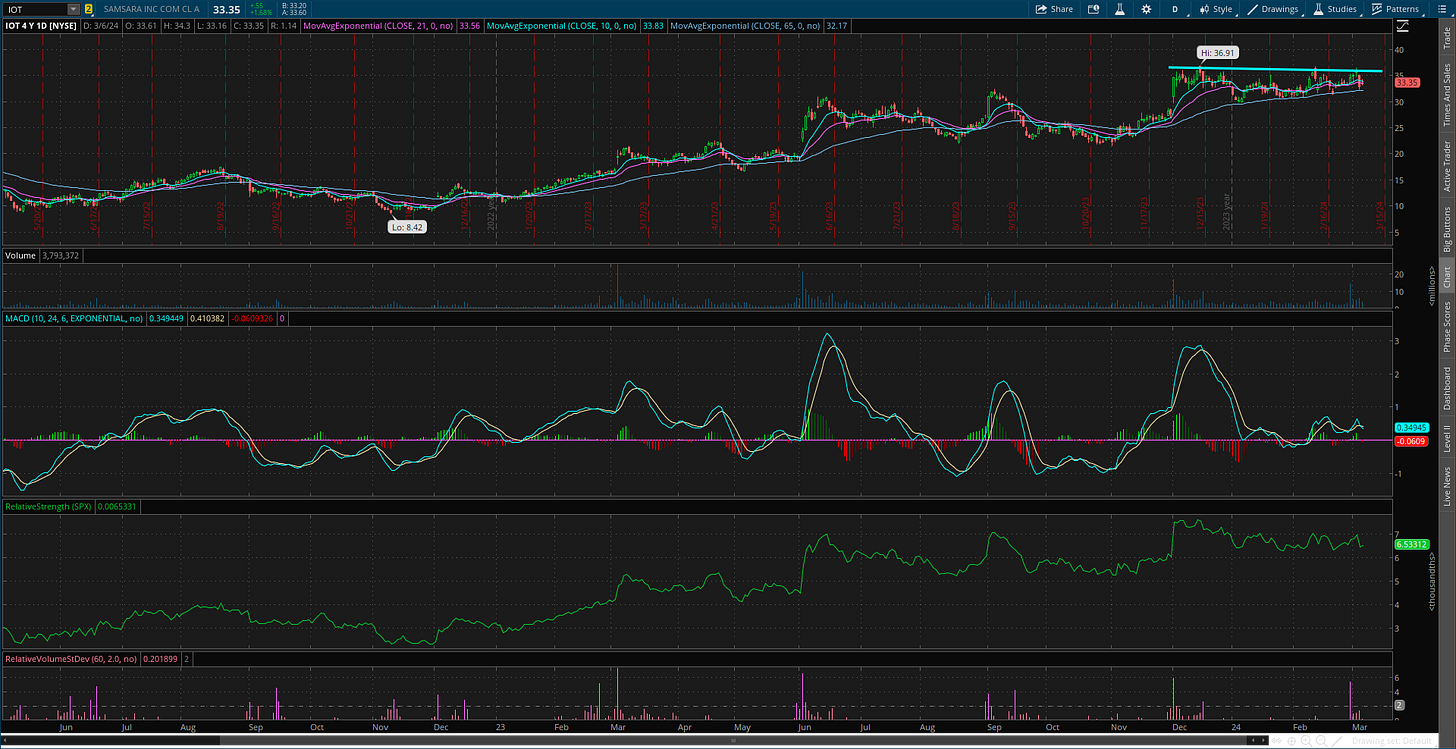
IOT
Consolidating gains since the start of December after the breakout to new highs over the $30 level. The RS line has weakened more than ideal, but support at the $30 level is being respected. Looking a move to new highs over $35.
BX
Since peaking back in 2021, the chart has the appearance of a large saucer-type pattern. Price recently nearing the prior high at $140 and now pulling back. That’s resetting the MACD while price holds support at $115. Watching for a move to new highs over $140.
Short Trade Setups
None this week!
Rules of the Game
I trade chart breakouts based on the daily chart for long positions. And for price triggers on long setups, I tend to wait until the last half hour of trading to add a position. I find that emotional money trades the open, and smart money trades the close. If it looks like a stock is breaking out, I don’t want a “head fake” in the morning followed by a pullback later in the day.
I also use the RS line as a breakout filter. I find this improves the quality of the price signal and helps prevent false breakouts. So if price is moving out of a chart pattern, I want to see the RS line (the green line in the bottom panel of my charts) at new 52-week highs. Conversely, I prefer an RS line making new 52-week lows for short setups.
Also for long positions, I use the 21-day exponential moving average (EMA) as a stop. If in the last half hour of trading it looks like a position will close under the 21-day EMA, I’m usually selling whether it’s to take a loss or book a profit.
For short (or put) positions, I trade off a four-hour chart instead of a daily. Why? There’s a saying that stocks go up on an escalator and down on an elevator. Once a profitable trade starts to become oversold on the four-hour MACD, I start to take gains. Nothing like a short-covering rally to see your gains evaporate quickly, so I’m more proactive taking profits on short positions. I also use a 21-period EMA on the four-hour chart as a stop. If there is a close above the 21-period EMA, I tend to cover my short.
For updated charts, market analysis, and other trade ideas, give me a follow on X: @mosaicassetco
Disclaimer: these are not recommendations and just my thoughts and opinions…do your own due diligence! I may hold a position in the securities mentioned in this post.


Great stuff, I see Gold and the dollar very similarly!