In this post, I’ll focus on setups that I’m monitoring for both long and short positions. With a chart and short write-up, this is a quick way to scan and plan potential trades.
These ideas are the end result of my process to identify stocks offering the right combination of growth fundamentals along with a proper chart setup.
Become a member of the Traders Hub to unlock this full report and get access to our Stock Trading Portfolio and ETF Investment Portfolio.
Members also receive:
✅Members Only Chat
✅Trade Ideas & Live Alerts
✅Mosaic Vision Market Updates + More
I believe the next major bull market phase is underway. Our open positions include high growth stocks, a play on Bitcoin, and other cyclical sectors breaking out.
Come and join us over at the Hub as we look to capitalize on the bull trend!
Stock Market Update
With elections and the latest Federal Reserve rate-setting meeting in the rearview, investors can focus on the next round of macroeconomic data. This week features updated reports on both consumer and producer price inflation. The Consumer Price Index (CPI) increased 2.6% in October compared to last year, while the core figure that strips out food and energy gained 3.3% (chart below). Both figures were in line with expectations.
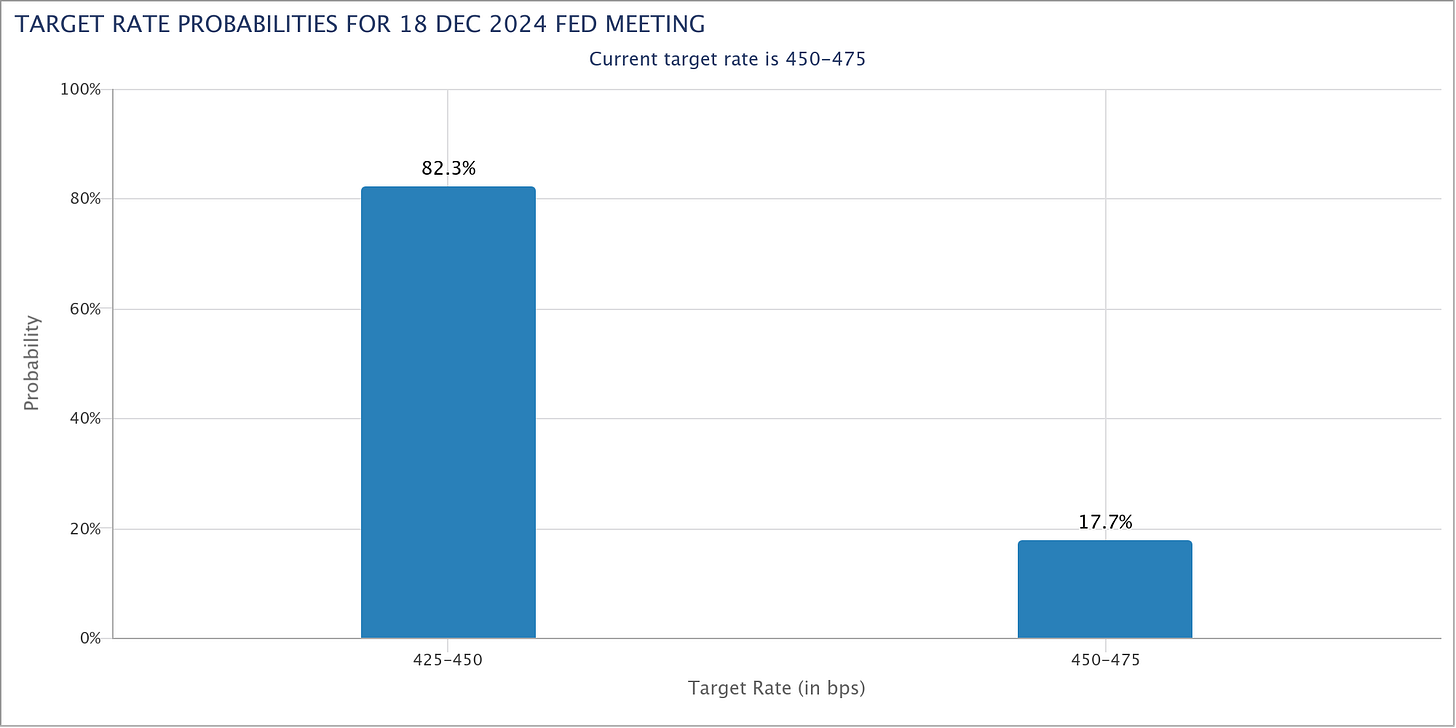
The recent trend in disinflation, which is marked by decelerating gains in the CPI, is stalling out in recent months as you can see in the chart. It’s also worth recalling that the Fed’s inflation target is 2%, with CPI remaining well above that threshold. But the CPI report isn’t negative enough to throw the Fed’s rate-cutting cycle off track. Market-implied odds show an 82% chance that the Fed cuts rates by another 0.25% at its December meeting (chart below). That’s a sharp increase from 59% odds for another cut the day before the CPI was released.
A Fed rate-cutting cycle that looks on track coupled with a strong economic growth outlook is creating a “Goldilocks” backdrop for the stock market. The performance of cyclical sectors along with high yield bonds are delivering a positive message about the earnings outlook. At the same time, recent performance in more speculative areas of the capital markets points to increasing animal spirits among investors. While some chart breakouts like Bitcoin are becoming too extended to consider new positions, other growth areas are still setting up. That includes SPDR S&P Biotech ETF (XBI) in the chart below. The biotech ETF started testing resistance around the $100 - $105 area back in March. Price has returned to that level several times since then, while also making a series of higher lows. A breakout in biotech shares would be another risk-on signal for investors.
We added a new stock position this week to take advantage of a constructive trading environment for breakouts, and are seeing positive price action across other portfolio holdings. Keep reading below to see our Traders Hub model portfolio of open positions and chart analysis for new trade ideas.


