Welcome back to Mosaic Chart Alerts!
In this post, I’ll focus on setups that I’m monitoring for both long and short positions. With a chart and short write-up, this is a quick way to scan and plan potential trades.
These ideas are the end result of my process to identify stocks offering the right combination of growth fundamentals along with a proper chart setup.
Here are my notes from a focus list of setups I’m monitoring.
Stock Market Update
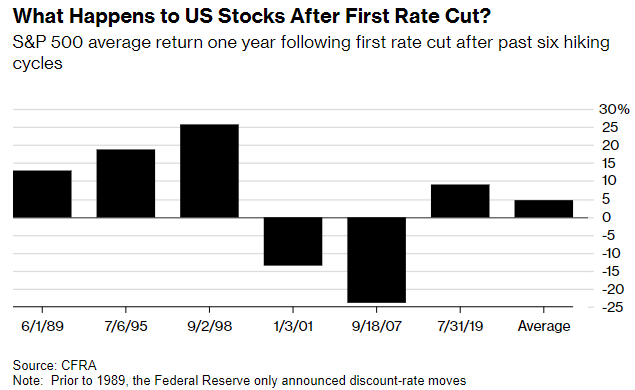
Heading into the Federal Reserve’s September meeting, the short-term fed funds rate was the most restrictive relative to inflation since just before the 2008 financial crisis. And it appears that the central bank does not want to risk leaving rates too high for too long again. Despite above target inflation and evidence that the economy is humming along just fine, the Fed opted to cut interest rates by 0.50% instead of just 0.25%. Fed Chair Jerome Powell commented that the larger cut could be taken “as a sign of our commitment not to get behind.” Following the meeting and Powell’s comments, the S&P 500 traded in a volatile range before finishing the day with a modest loss. Longer term, the chart below shows how the S&P 500 has performed 12 months following the start of the last seven cutting cycles.
As the chart above shows, not all rate cutting cycles are positive for stocks. But the periods when the S&P 500 faced losses were also marked by recession. In those instances, the Fed held rates in restrictive territory for too long (along with other circumstances) which ultimately pushed the economy into recession. This time around, current economic data and forward-looking capital market sectors are painting a positive picture regarding the outlook.
Initial jobless claims remain near historically low levels, while retail sales increased by 2.1% year-over-year in August following a surge higher in July as well. Incoming data is boosting the Atlanta Fed’s GDPNow estimate, which is pointing to 2.9% annualized GDP growth for the third quarter. In this week’s Mosaic Vision Market Update, I also showed you how high yield bonds are delivering a positive message on the economic outlook. When the Fed cuts rates and the economy avoids recession, the forward path is historically positive for the S&P 500. And looking back, small-caps perform even better as I reviewed in my weekend report. That makes the current setup in the IWM exchange-traded fund that tracks the Russell 2000 Index of small-caps even more compelling. In the chart below, IWM is setting up a bullish pennant pattern shown with the dashed trendlines. Price is coiling inside the pattern, where I’m watching for a sustained move to hold over the $220 level. A breakout from the pattern would also be another positive signal for the economic outlook.
While it’s reasonable to expect stock market volatility during this historically weak seasonal stretch and heading into November elections, the longer-term outlook remains constructive for the bull market in my opinion. It’s also interesting to note that breakout setups are recently playing out with strong follow through. That includes APP, GE, and NOW from the watchlist, so I’m removing those stocks as their chart patterns complete. I have chart updates for other trade ideas that remain on watch.
Keep reading below for all the updates…
Long Trade Setups
CCS
After moving over the $90 level, the stock is consolidating gains and back testing that level as support while creating a bullish pennant pattern. The MACD is resetting at the zero line with the relative strength (RS) line holding near the high. I’m watching for a move over $107.
META
Putting the stock back on the watchlist. Peaked around $530 in April and tried to breakout over that level in July. The move was not confirmed by the RS line and price fell back into the base. Smaller pullbacks with the MACD now resetting. Watching for a move over $545.
CYBR
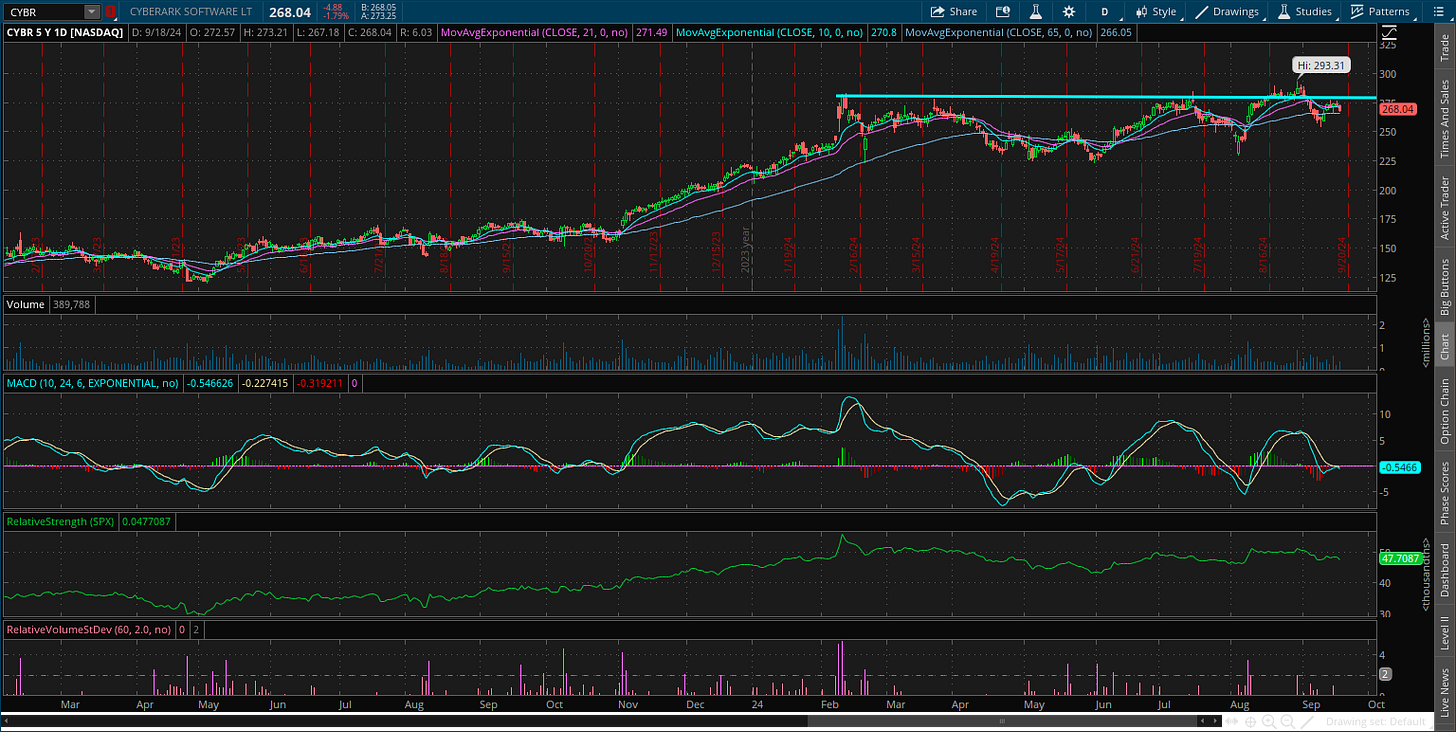
Trading sideways since February while testing resistance at the $280 level on three occasions. Price is now back near the $280 level, where I would like to see one more smaller pullback that resets the MACD at the zero line before breaking out. The RS line is also holding near the high.
TAYD
Peaked at the $60 level after moving out of a large base in January. Consolidating gains since April, with the stock moving over an initial resistance level at $53. Now testing the prior high at $60 where I want to see a small pullback before trying to break out.
LNW
Good basing action after the stock peaked just under $110 in March. Price is recently retesting that level after getting one smaller pullback that reset the MACD at the zero line. That sets up a move to new highs over $110.
FG
Broke out of a base back in November and rallied to the $48 area. Consolidating gains since the start of the year and recently rallying back toward $48. Want to see price hold support at the $35 level on any pullback.
Rules of the Game
I trade chart breakouts based on the daily chart for long positions. And for price triggers on long setups, I tend to wait until the last half hour of trading to add a position. I find that emotional money trades the open, and smart money trades the close. If it looks like a stock is breaking out, I don’t want a “head fake” in the morning followed by a pullback later in the day.
I also use the RS line as a breakout filter. I find this improves the quality of the price signal and helps prevent false breakouts. So if price is moving out of a chart pattern, I want to see the RS line (the green line in the bottom panel of my charts) at new 52-week highs. Conversely, I prefer an RS line making new 52-week lows for short setups.
Also for long positions, I use the 21-day exponential moving average (EMA) as a stop. If in the last half hour of trading it looks like a position will close under the 21-day EMA, I’m usually selling whether it’s to take a loss or book a profit.
For short (or put) positions, I trade off a four-hour chart instead of a daily. Why? There’s a saying that stocks go up on an escalator and down on an elevator. Once a profitable trade starts to become oversold on the four-hour MACD, I start to take gains. Nothing like a short-covering rally to see your gains evaporate quickly, so I’m more proactive taking profits on short positions. I also use a 21-period EMA on the four-hour chart as a stop. If there is a close above the 21-period EMA, I tend to cover my short.
For updated charts, market analysis, and other trade ideas, give me a follow on X: @mosaicassetco
Disclaimer: these are not recommendations and just my thoughts and opinions…do your own due diligence! I may hold a position in the securities mentioned in this post.


