

Welcome back to Mosaic Chart Alerts!
In this post, I’ll focus on setups that I’m monitoring for both long and short positions. With a chart and short write-up, this is a quick way to scan and plan potential trades.
These ideas are the end result of my process to identify stocks offering the right combination of fundamentals along with a proper chart setup.
Here are my notes from a focus list of setups I’m monitoring.
Stock Market Update
With no deal in sight to raise the debt ceiling, investor jitters over the prospect of a U.S. default are intensifying. After initially shrugging off news that negotiations were falling apart late last week, stocks are finally starting to react. That also means a failed attempt at a breakout for the S&P 500. With the index failing to hold its move over the resistance level shown below, it’s now close to testing the 50-day moving average (black line in the chart).
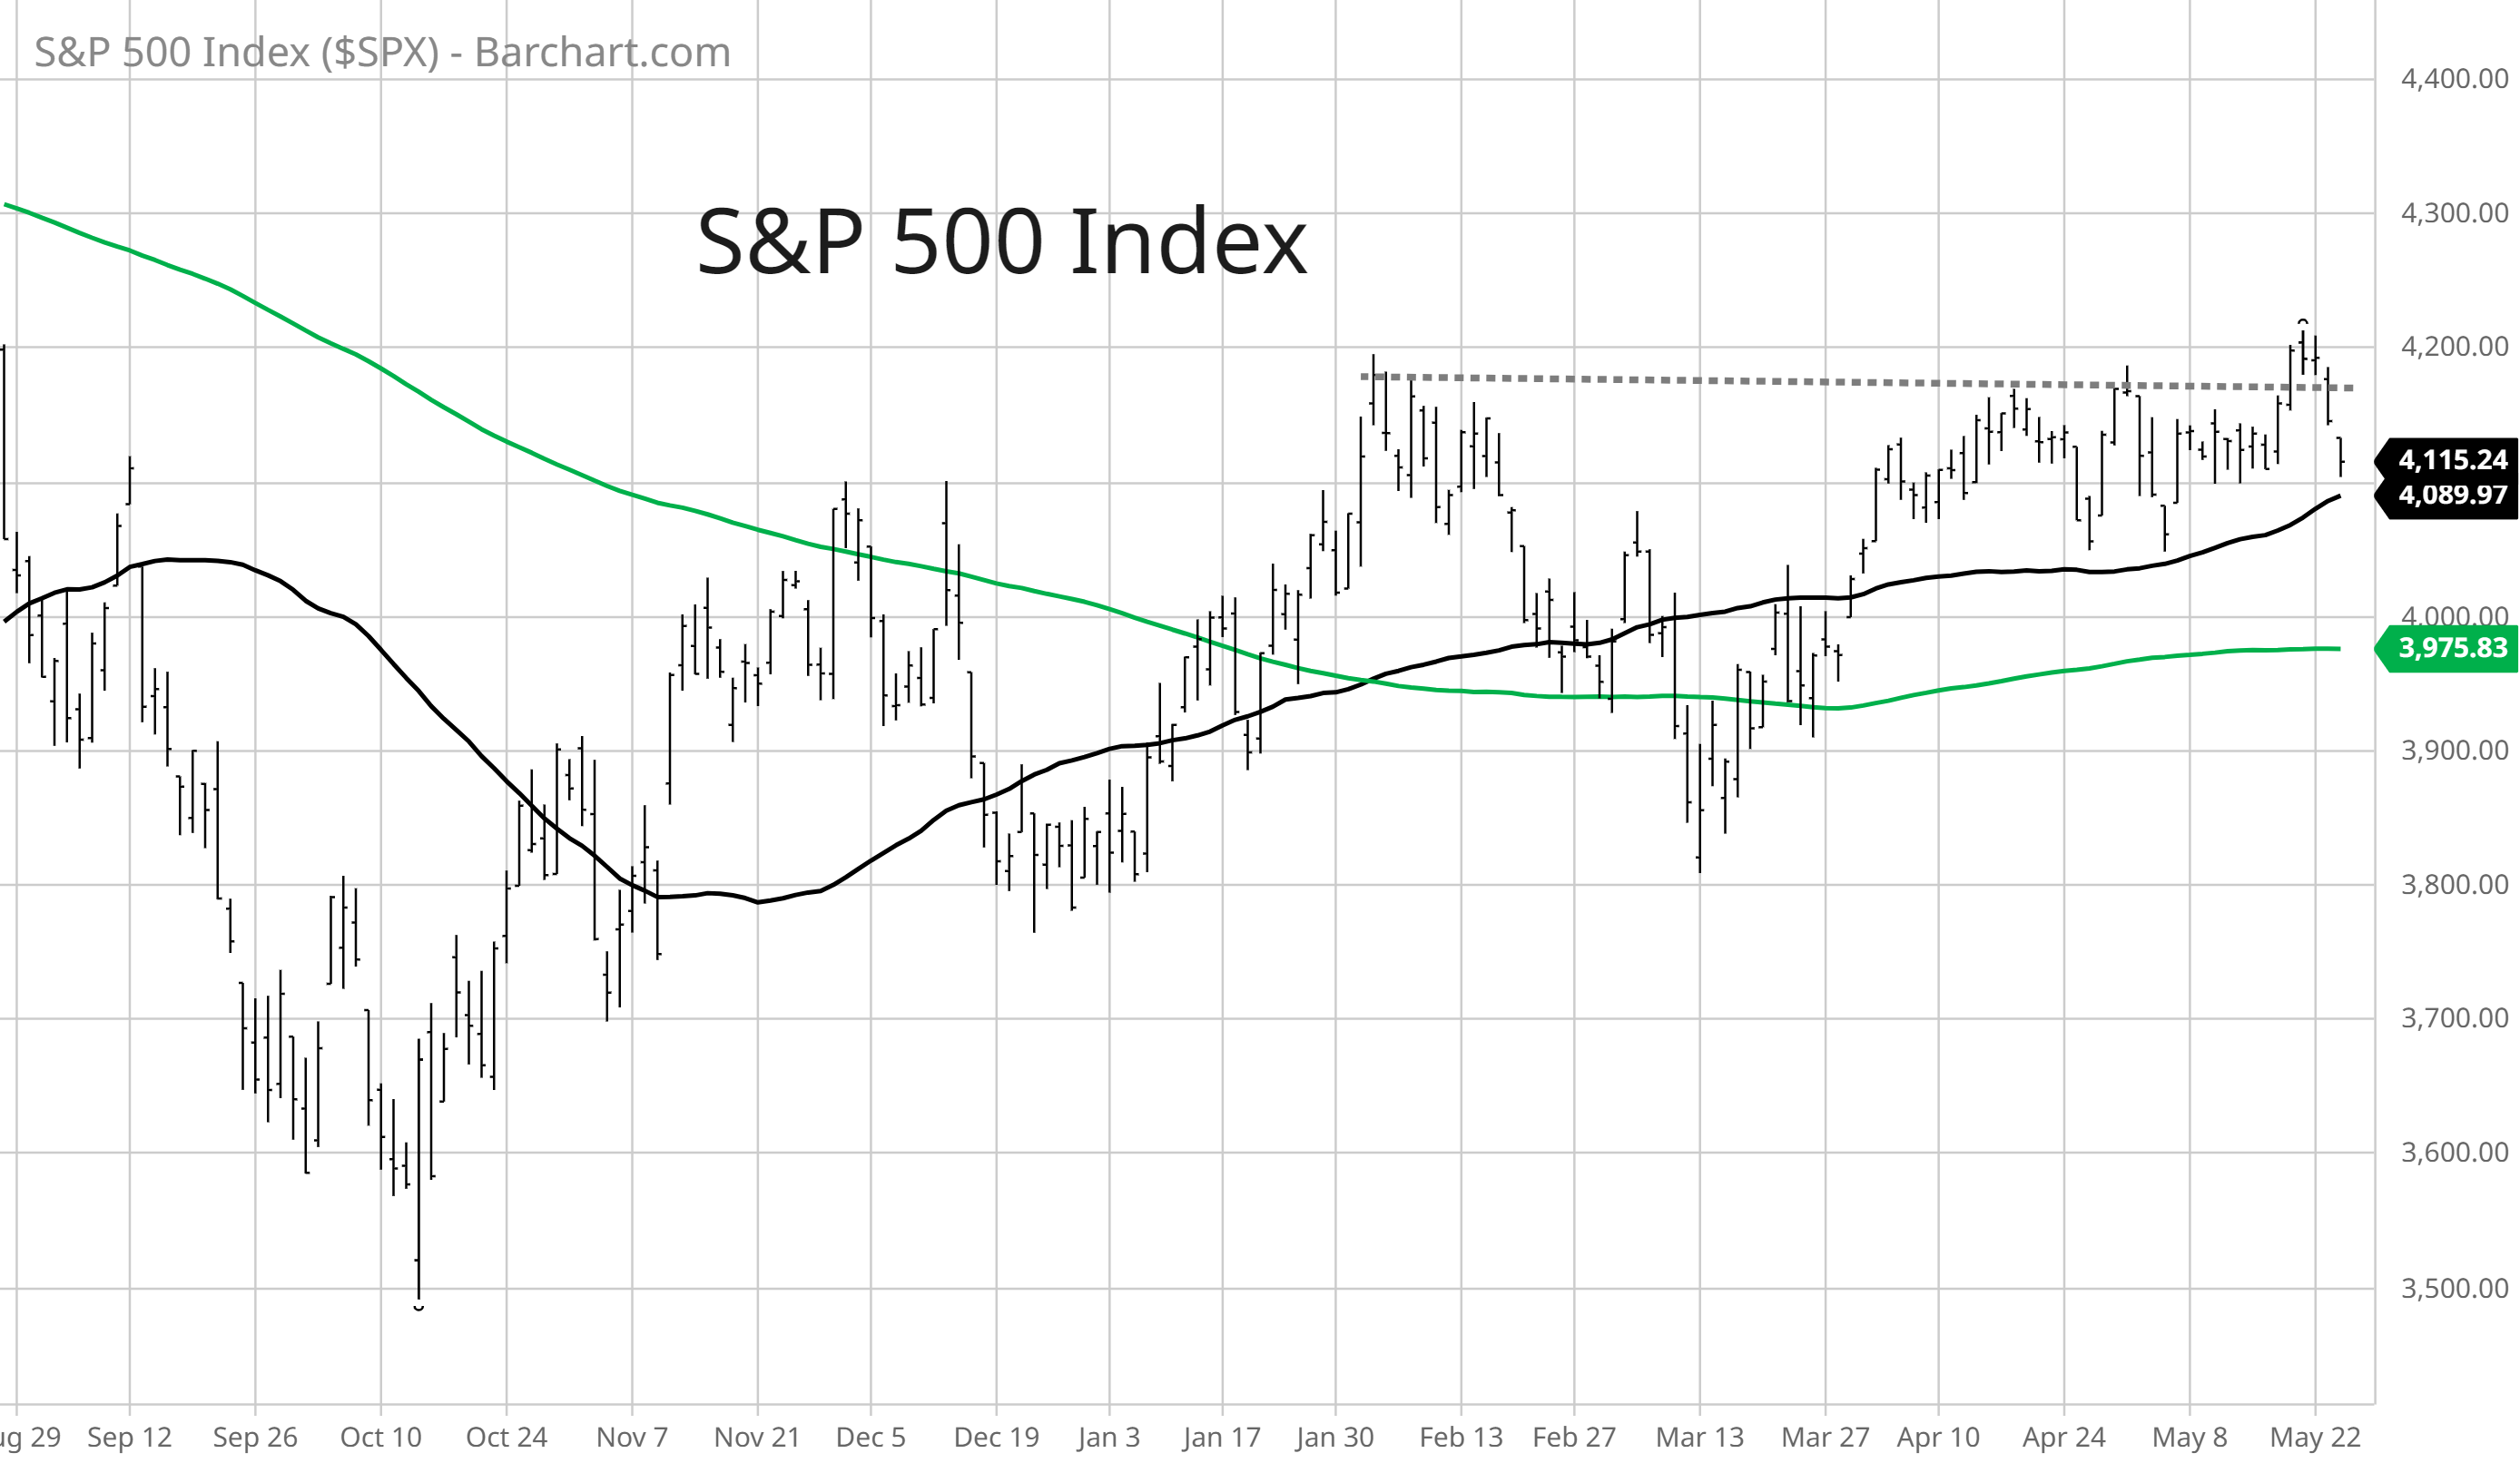
Despite the failed breakout attempt, the S&P 500 still has series of higher highs and higher lows off the October bottom, indicating the uptrend remains intact. But the same can’t be said with other cyclical areas of the market, and this is where the picture is more concerning. The JNK high yield bond ETF is close to breaking down from a triangle pattern as you can see in the chart below. I’ve also recently highlighted other sectors to monitor, like with the IWN small-cap value ETF. With large exposures to regional banks and real estate, IWN remains close to breaking down to new bear market lows.

The recent action is disappointing given the green shoots of improving breadth last week. New 52 week highs across the major exchanges finally started outpacing new lows, but that was quickly reversed with today’s action. But despite the S&P’s failed attempt, recent breakouts from the watchlist are holding up so far. That includes with RNGR and SPSC, which are coming off watch as they complete their patterns. I’m also removing FNV, as price weakness in gold stocks invalidates the setup. I’m also taking JWN off the short watchlist as recent price strength takes the stock above key moving averages. That means there are new additions to both lists.
Keep reading below for all the updates…
Long Trade Setups
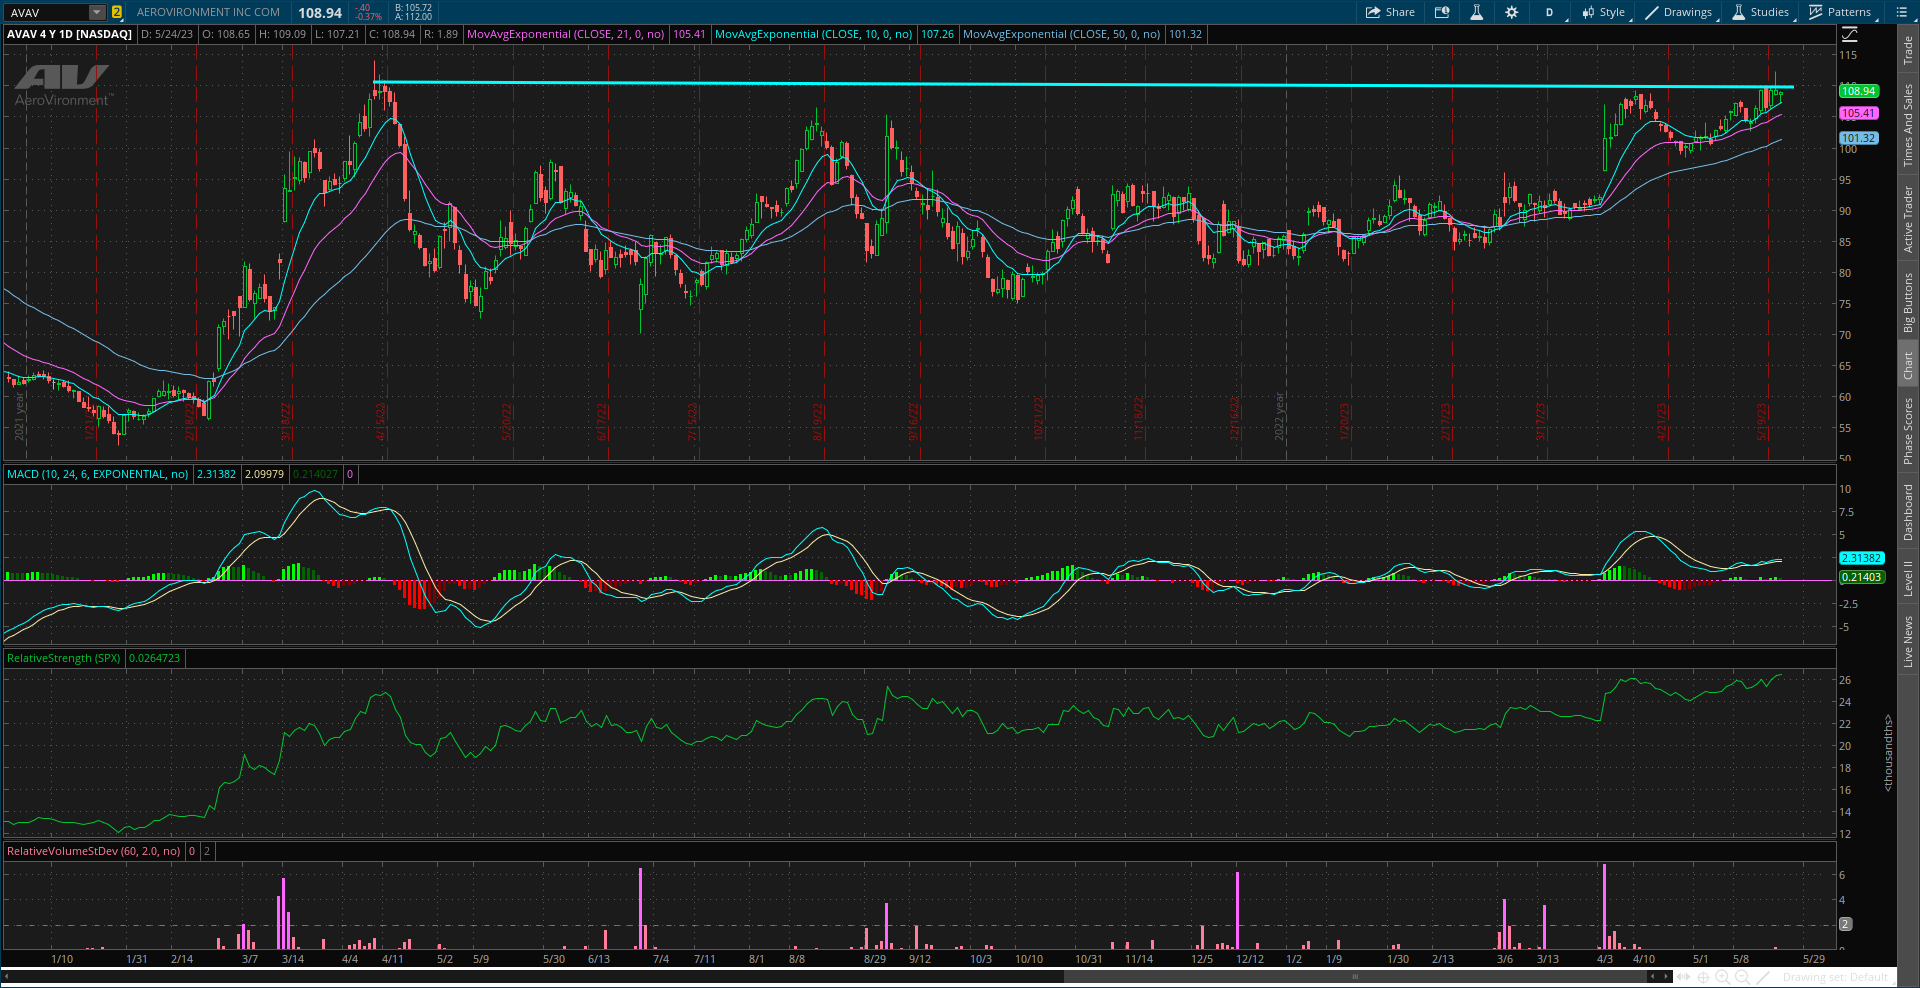
AVAV
Recent MACD reset as price is testing resistance at the $110 level which stretches back a year. Want to confirm any breakout attempt with volume expansion and relative strength (RS) line making a new 52-week high.
CIVI
Energy exploration and production company coming up to resistance of this triangle pattern. Watching if price can move above the $75 level followed by new all-time highs.

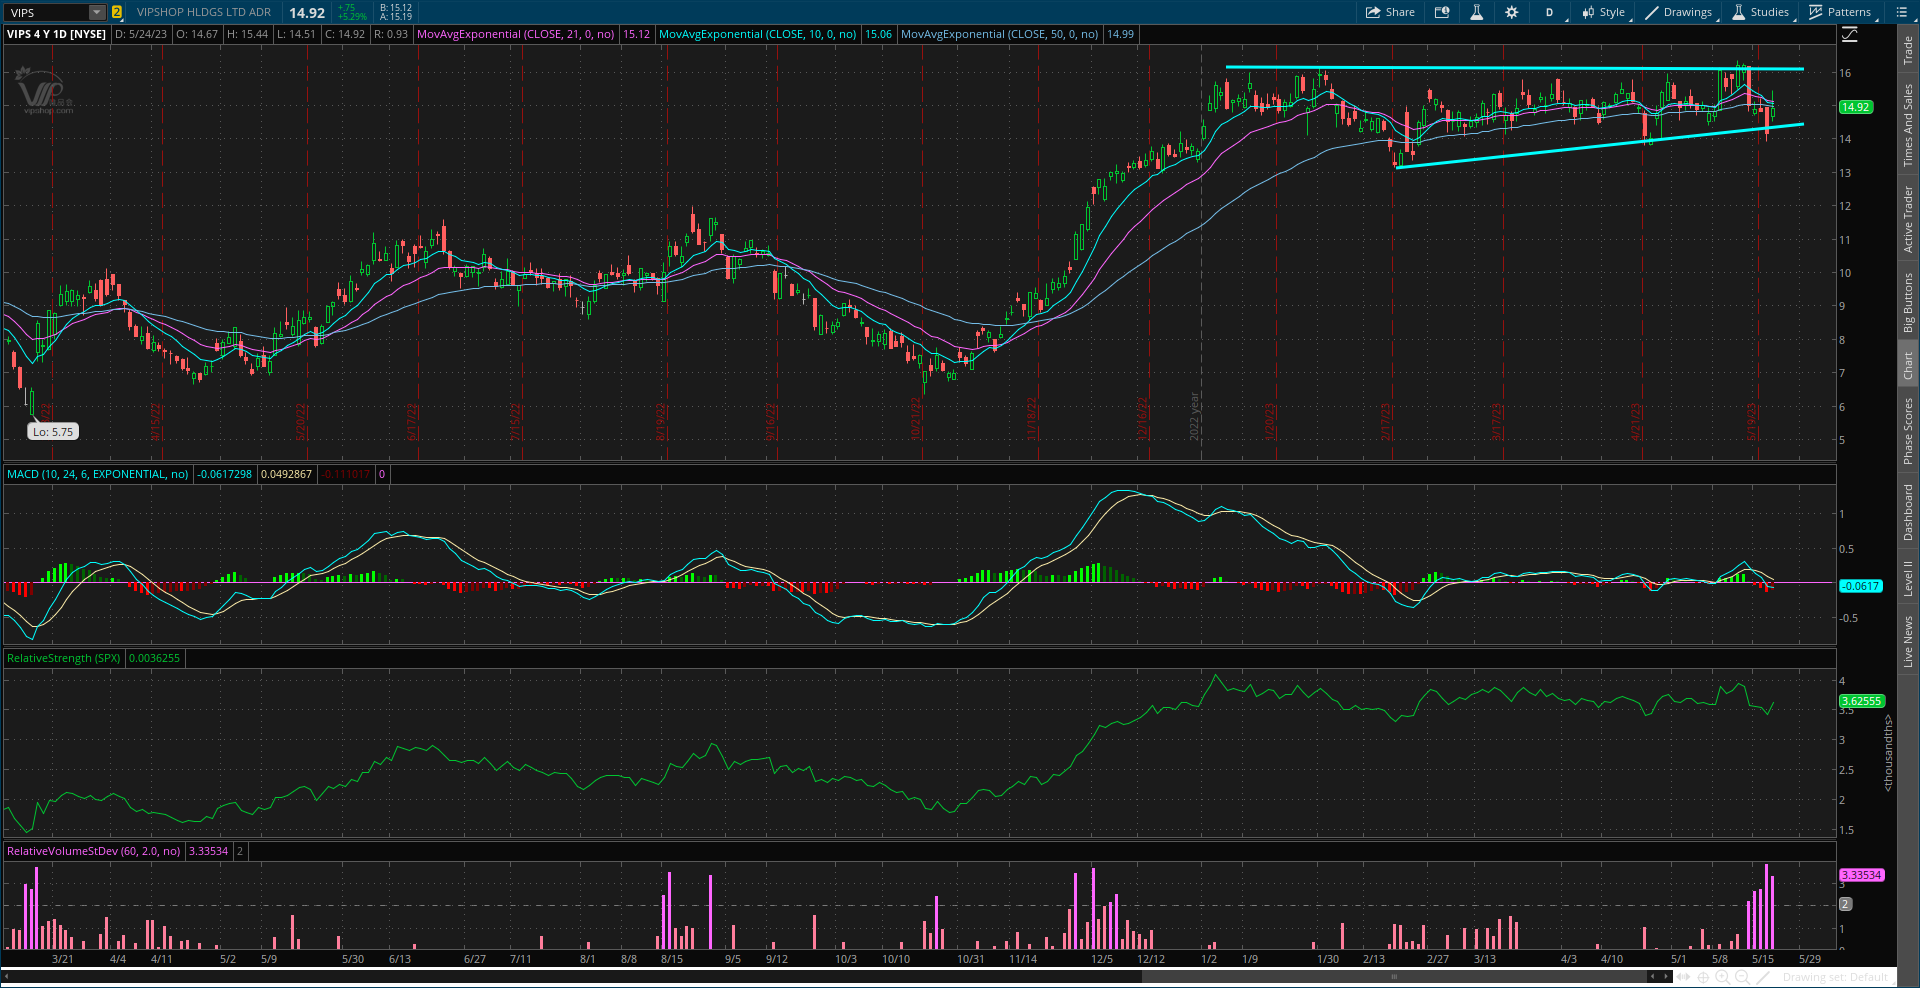
VIPS
Take this chart back farther, and you will see the stock is trying to emerge from a bottoming process. Trading in the consolidation range shown since early January with the RS line hovering near the highs. Watching for a move over $16.50.
NOVT
Making a series of higher lows off the October bottom. Recently creating resistance around the $170 level, where a move above could target the prior highs.

SKT
Testing the $20 level several times since late November. Recent big price bars seeing an increase in volume while the MACD turns up from the zero line with the RS line near the highs.

NVGS
Trading in a consolidation pattern since last June, creating an ascending triangle. Showing very volatile price action past couple trading sessions, but will keep on watch for a breakout over the $15 level since it’s still within the pattern.

Short Trade Setups
SPT
Recently testing the $38 support level from last year. The move higher following the gap in early May is resetting the MACD below the zero line, where downside momentum can support a breakdown.

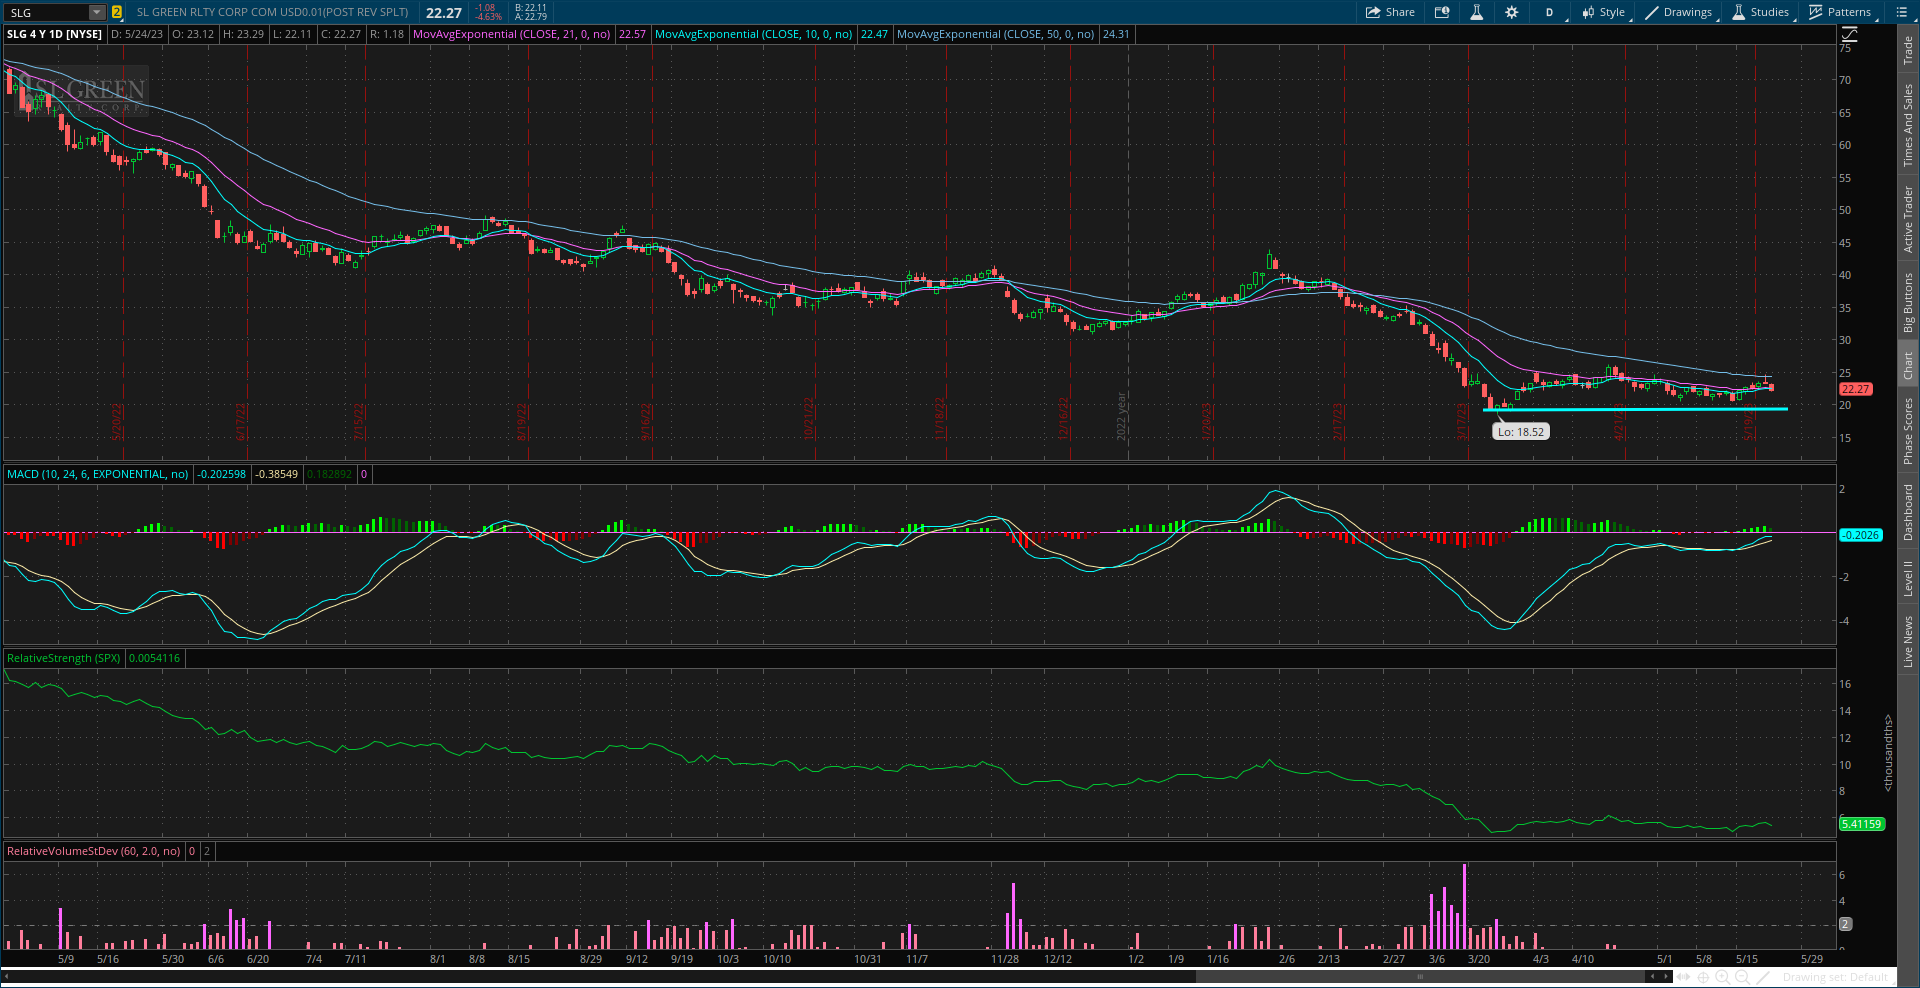
SLG
Been testing the $20 support level. Bounced off this area in March, but a longer-term chart shows the importance of this area going back to 2020. MACD reset under the zero line with RS hovering near the lows.
CHPT
Testing support just above the $8 level while the RS line remains near all time lows. Looking for a downside continuation move with a break of support.

Rules of the Game
I trade chart breakouts based on the daily chart for long positions. And for price triggers on long setups, I tend to wait until the last half hour of trading to add a position. I find that emotional money trades the open, and smart money trades the close. If it looks like a stock is breaking out, I don’t want a “head fake” in the morning followed by a pullback later in the day.
I also use the RS line as a breakout filter. I find this improves the quality of the price signal and helps prevent false breakouts. So if price is moving out of a chart pattern, I want to see the RS line (the green line in the bottom panel of my charts) at new 52-week highs. Conversely, I prefer an RS line making new 52-week lows for short setups.
Also for long positions, I use the 21-day exponential moving average (EMA) as a stop. If in the last half hour of trading it looks like a position will close under the 21-day EMA, I’m usually selling whether it’s to take a loss or book a profit.
For short (or put) positions, I trade off a four-hour chart instead of a daily. Why? There’s a saying that stocks go up on an escalator and down on an elevator. Once a profitable trade starts to become oversold on the four-hour MACD, I start to take gains. Nothing like a short-covering rally to see your gains evaporate quickly, so I’m more proactive taking profits on short positions. I also use a 21-period EMA on the four-hour chart as a stop. If there is a close above the 21-period EMA, I tend to cover my short.
For updated charts, market analysis, and other trade ideas, give me a follow on Twitter: @mosaicassetco
Disclaimer: these are not recommendations and just my thoughts and opinions…do your own due diligence! I may hold a position in the securities mentioned in this post.