Mosaic Chart Alerts
Watch for this range breakout on the S&P 500; breadth continues to improve.
Welcome back to Mosaic Chart Alerts!
In this newsletter, I’ll focus on the best setups that I’m monitoring for both long and short positions. With a chart and short write-up, this is a quick way to scan and plan potential trades.
These ideas are the end result of my process to identify stocks offering the right combination of fundamentals along with a proper chart setup.
Here are my notes from a shortlist of setups I’m monitoring.
Stock Market Update
This first week of 2023 is packed full of important economic reports along with the minutes from the last Federal Reserve meeting released earlier today. On balance, members of the Fed’s rate-setting committee are still hawkish and made specific mention of “unwarranted easing in financial conditions.” Also today, the underlying components of the ISM Manufacturing survey paint a gloomy picture for the economy and stock market (I posted about it here). A hawkish Fed and deteriorating leading indicators means the underlying drivers of this bear market have not gone away.
But even bear markets can see powerful rallies that can span months. I’ve been posting frequently about improving breadth in the stock market, which you can read about here. At the same time, we saw an uptick in bearish sentiment at the end of December as I covered in last week’s Market Mosaic. Those are key ingredients to have in place for a rally to unfold, and push the S&P 500 out of its trading range of the past two weeks. Here’s a four-hour chart of S&P 500 futures below, with the trading range highlighted.
Even though I favor a move higher from this range, I’m not taking new trades until chart patterns complete the setups that I’m outlining below. There’s turnover to the list that I want to highlight this week. First, I’m removing NRP following last week’s breakout (see Rules of the Game below for how I manage open positions). I’m also removing TS following disappointing action, where the stock attempted to breakout and subsequently fell back into the pattern. I’m also removing DIS from the short watchlist as recent strength invalidates the chart setup. I’m making several new additions to both the long and short watchlist…keep reading for updates.
Long Trade Setups
TRI
Trendlines show a triangle consolidation pattern. Price is right at trendline resistance with the MACD turning higher. Nice surge in volume on last two trading days.
OI
Breaking out today over this trendline resistance level. That follows a tightening trading range while showing good relative strength last month. Big volume on recent up days.
SCHW
Not a very clean basing structure, but relative strength is holding up quite well in this market. MACD also reset at the zero line and is turning higher. Using the $83-85 resistance level as a possible trigger.
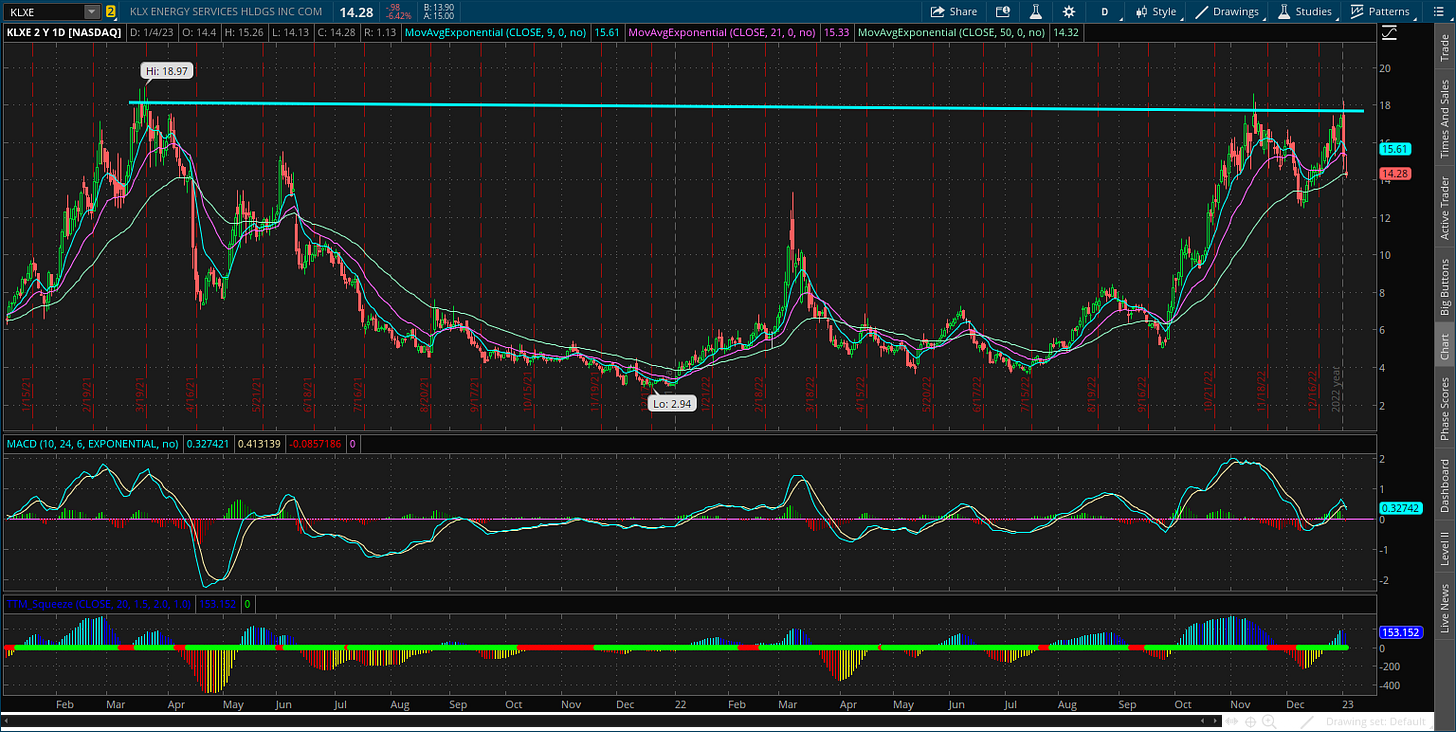
KLXE
Turned away again this week at the $19 resistance level. Seeing relative weakness in the stock today, but will keep on watch as long as price holds the 50-day MA. Still have MACD in a position to support a potential breakout.
RNGR
Price resistance around the $11.50 level tested several times over the past 16 months. Still trading in a tight range just below that level. A more speculative smaller-cap name, so position size accordingly.
NSP
Basing pattern going back a year creating a resistance level at $120. Still holding the $110 level while it trades within the pattern. Don’t like recent action, but will keep on the list for another week.
Short Trade Setups
TTD
The $40 support level tested several times since May is coming back into play. Using a close below as a trigger level.
SNOW
Creating a bearish continuation pattern. Using trendline support as a trigger, which sits around the $130 price level.
W
Previously broke down from a bearish continuation pattern highlighted several weeks ago. The next big support level sits around $30.
DKNG
This descending triangle pattern remains in play. After rejecting off trendline resistance, price is sitting right on $11 support which is also the trigger level.
Rules of the Game
If you haven’t noticed yet, I trade breakouts! I trade based on the daily chart for long positions. And for price triggers on long setups, I tend to wait until the last half hour of trading to add a position. I find that emotional money trades the open, and smart money trades the close. If it looks like a stock is breaking out, I don’t want a “head fake” in the morning followed by a pullback later in the day.
Also for long positions, I use the 21-day exponential moving average (EMA) as a stop. If in the last half hour of trading it looks like a position will close under the 21-day EMA, I’m usually selling whether it’s to take a loss or book a profit.
For short (or put) positions, I trade off a four-hour chart instead of a daily. Why? There’s a saying that stocks go up on an escalator and down on an elevator. Once a profitable trade starts to become oversold on the four-hour MACD, I start to take gains. Nothing like a short-covering rally to see your gains evaporate quickly, so I’m more proactive taking profits on short positions. I also use a 21-period EMA on the four-hour chart as a stop. If there is a close above the 21-period EMA, I tend to cover my short.
For updated charts, market analysis, and other trade ideas, give me a follow on twitter: @mosaicassetco
Disclaimer: these are not recommendations and just my thoughts and opinions…do your own due diligence! I may hold a position in the securities mentioned in this newsletter.


