In this post, I’ll focus on setups that I’m monitoring for both long and short positions. With a chart and short write-up, this is a quick way to scan and plan potential trades.
These ideas are the end result of my process to identify stocks offering the right combination of growth fundamentals along with a proper chart setup. Live alerts are sent to Traders Hub members only.
Stock Market Update
Relative calm on the stock market’s surface is masking a spike in volatility across the average stock. The S&P 500 is trading in a tight range since the end of October and is bringing realized volatility over that stretch to historically low levels. But there have been massive moves across individual stocks and sectors. Several of the biggest names leveraged to the artificial intelligence (AI) trade are well off their prior highs, while advances in AI is leading investors to flee software stocks. Meanwhile, stocks in capital intensive industries like energy are leading the way higher on the year. The end result is that the difference between volatility on the S&P 500 and realized volatility in the S&P’s constituents is reach the highest levels in over a decade (green line in the chart below).

The rotation underway is an important lesson to not become fixated on prior market leadership. Combining share price momentum with relative strength analysis (relative price movements to the S&P 500) is a great way to stay focused on new emerging leadership and avoid market laggards. It’s also important to be aware of the risks around index investing with ETFs like SPY and QQQ given just a handful of companies dominate the indexes. Given their large allocations and the state of valuations, a drawdown in AI and growth stocks could weigh heavily similar to the aftermath of the 1990s internet bubble. But while tech stocks took the indexes down back then, other market sectors (such as small- and mid-cap value) held up extremely well. The current style box breakdown using returns since the end of October (table below) reminds me of the environment following the internet bubble, where growth stocks weighed on the indexes and masked strength elsewhere.

That is why I’m delivering an approach to Traders Hub members that rotates with the market in order to spot the best trading opportunities. A massive change in market leadership is already underway and is exposing the risks of index investing in vehicles like the S&P 500, while a more active approach is needed to stay one step ahead. Keep reading to see:
Open ETF positions.
Open stock positions.
Chart analysis for new trade ideas.
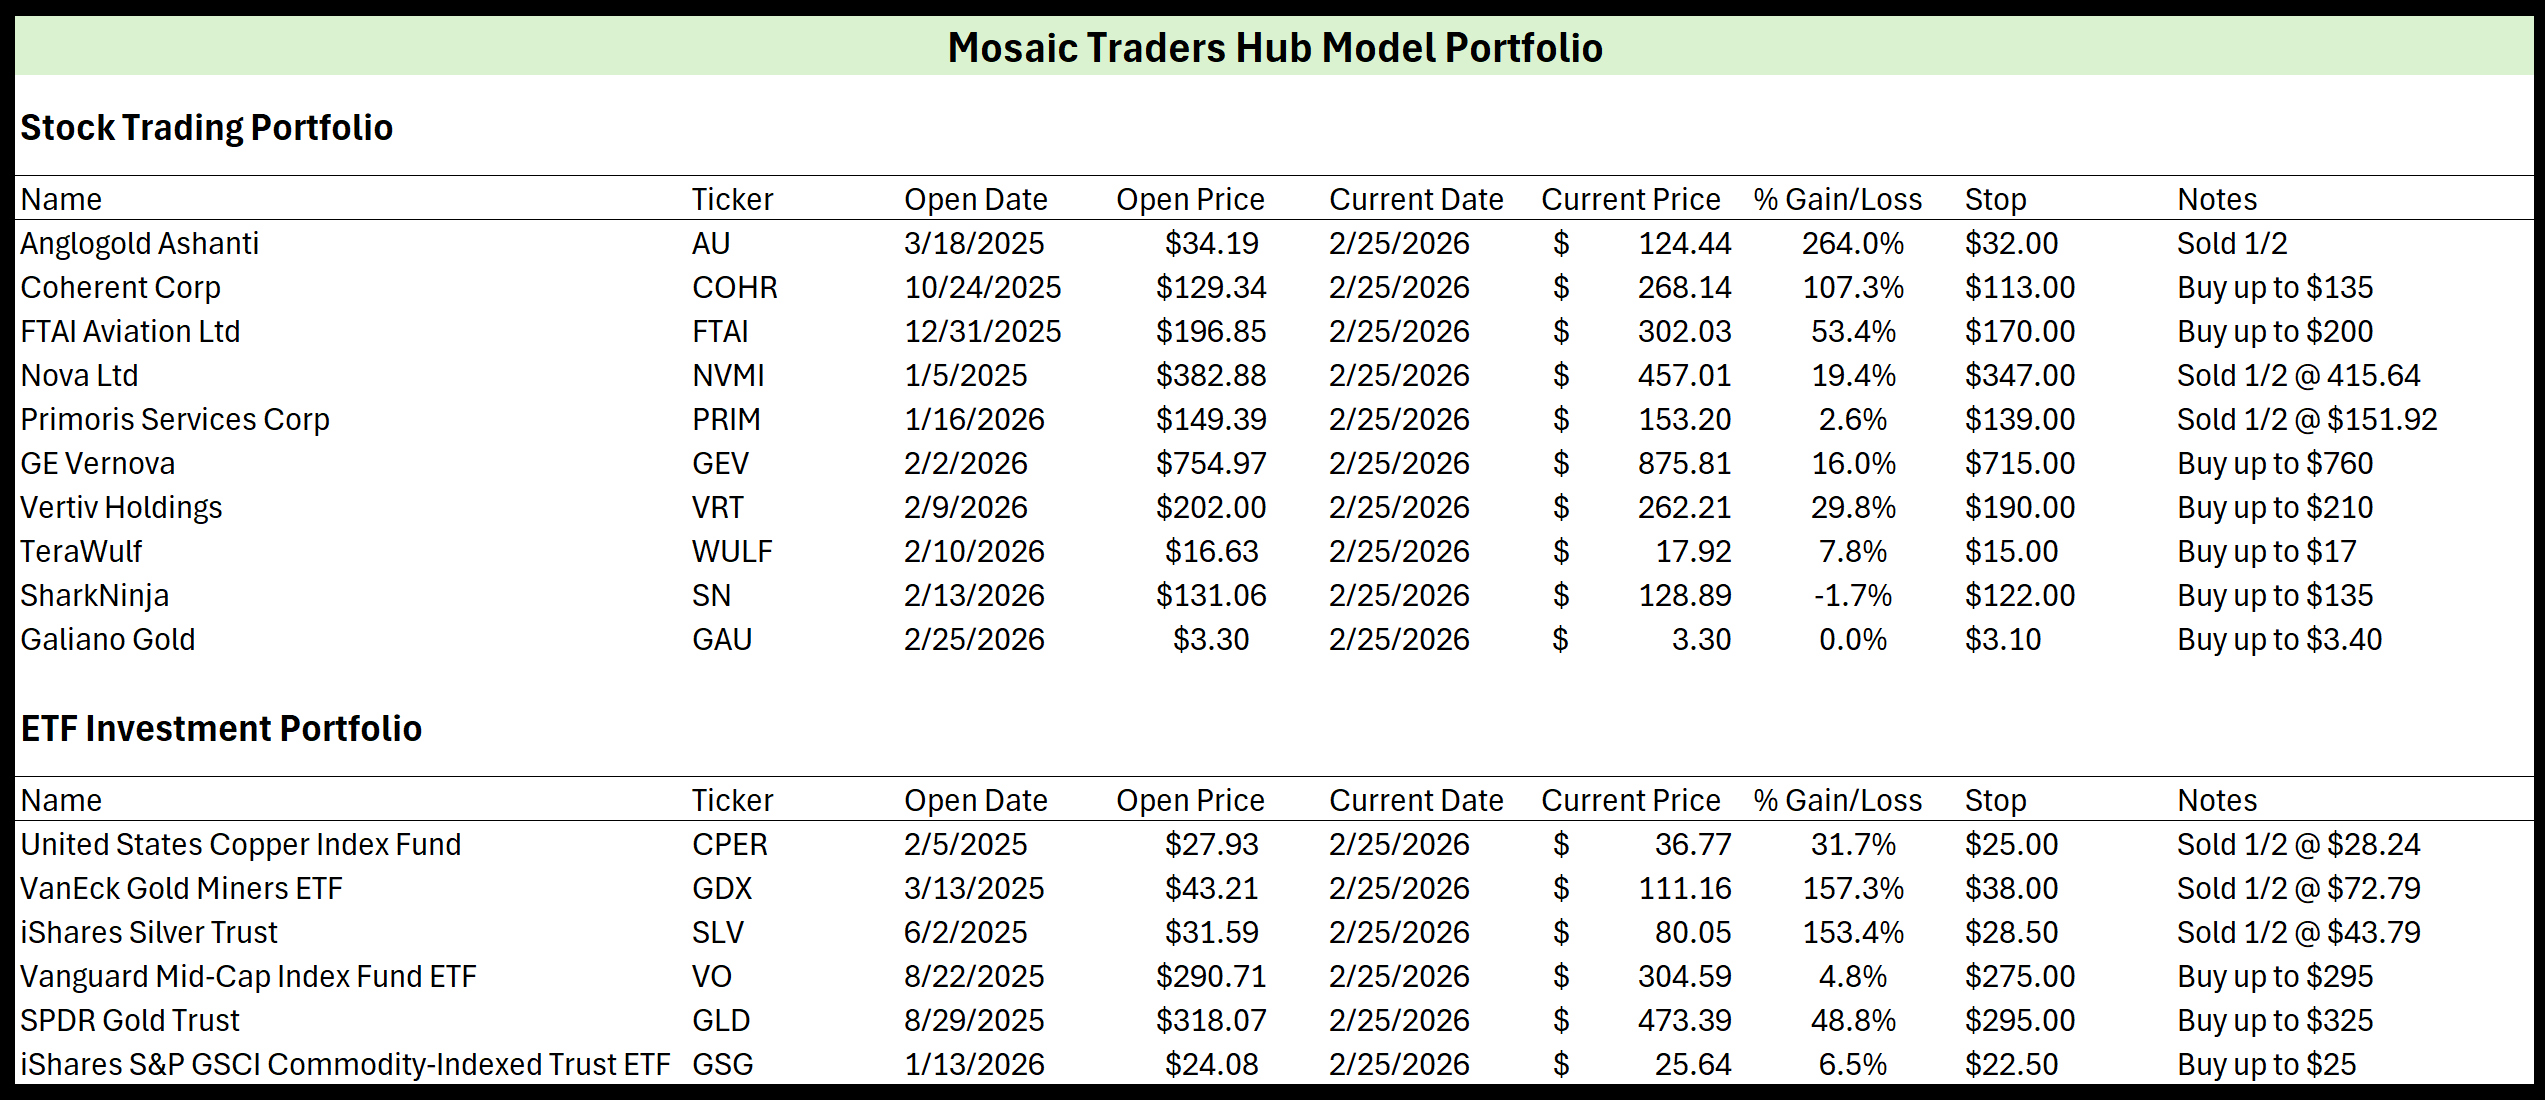
Traders Hub Model Portfolio
Here’s our model portfolio of open positions. You will see them separated into a Stock Trading Portfolio and ETF Investment Portfolio. These positions are sometimes alerted in the chat, but I will send an email alert for new positions when possible.