Mosaic Chart Alerts
S&P 500 loses the 50-day MA; breakdowns spreading across growth stocks.
Welcome back to Mosaic Chart Alerts!
In this newsletter, I’ll focus on the best setups that I’m monitoring for both long and short positions. With a chart and short write-up, this is a quick way to scan and plan potential trade ideas.
And to select these ideas, a lot of work goes on behind the scenes to find stocks offering the right combination of fundamental attributes along with a proper chart setup.
These are my notes from a shortlist of setups I’m monitoring.
Weekly Recap
In last week’s Market Mosaic, I talked about how a combination of increasingly bullish sentiment along with overbought breadth was a reason to be cautious. That was especially the case with a highly anticipated Federal Reserve meeting on deck.
Chatter around a pivot to a dovish policy stance increased recently following an article that appeared in the Wall Street Journal. But as I’ve highlighted repeatedly in this newsletter, the Fed is nowhere near achieving its mandate of price stability, while the labor market remains strong (both mandates are also lagging economic indicators). But at the same time, leading indicators of economic activity are deteriorating quickly. That’s a bad combination for stocks, which explains the sharp pullback in share prices following the Fed’s fourth straight 0.75% rate hike. The chart of the S&P 500 below shows price falling back below the 50-day moving average, while also breaking down from the trend channel.
While I still believe we’re stuck in a bear market, there are opportunities to profit by playing the long side. We’ve seen that with TDW, HLIT, CCRN, and DINO over the past month. But I’m position sizing conservatively and taking gains more quickly. For this week’s watchlist, I’m seeing more opportunities to play breakdowns so my focus is expanding our list of short setups. I’m also removing IRDM from our long setups with its breakout, as well as DVN following today’s sharp pullback and close below the 50-day moving average. Keep reading for other updates to the watchlist.
Long Trade Setups
AMAL
Banking stock bucking the trend of overall market weakness today. Breaking out over the $25 level on increasing volume. Would not want to see this stock fall back into the base.
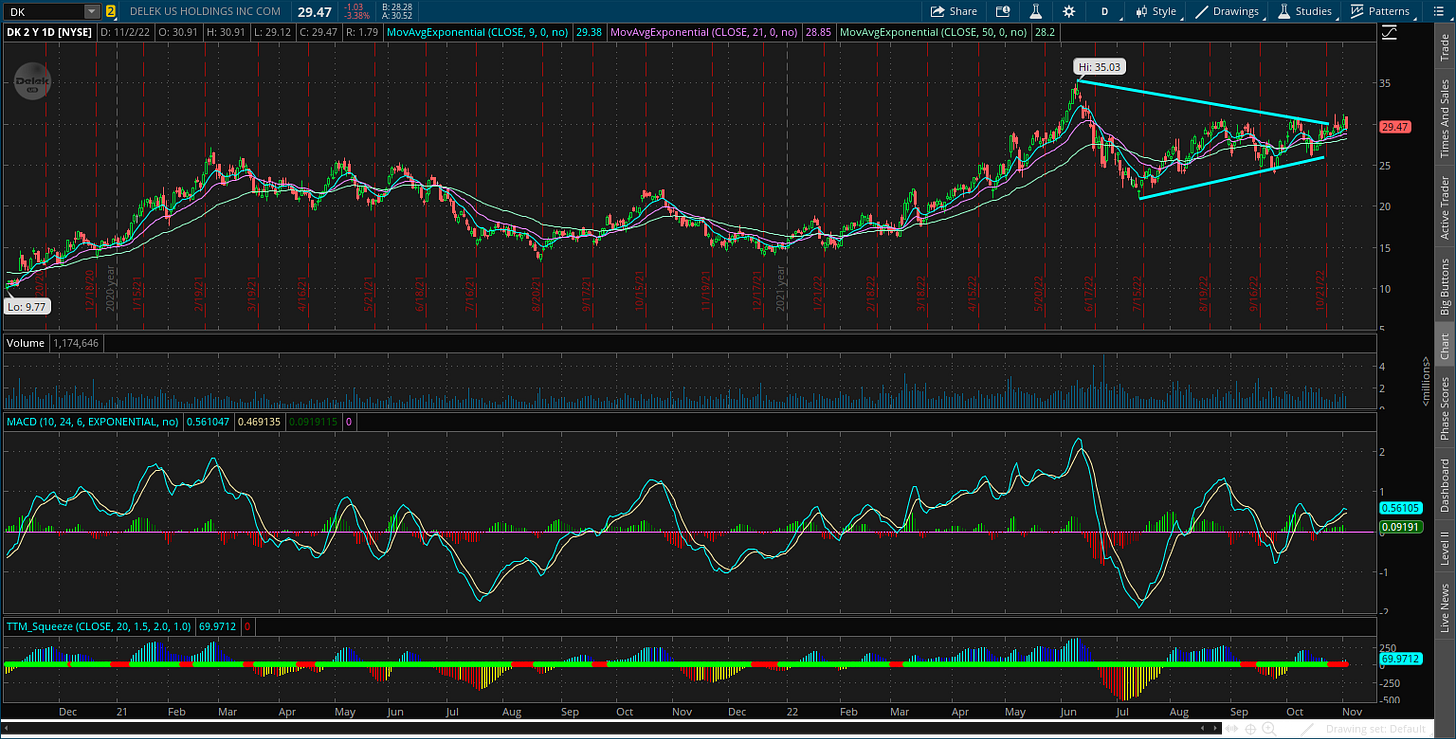
DK
Refining stock setting up a breakout from this triangle consolidation pattern. Want to see the stock hold over the $30 level for confirmation.
UI
Choppy sideways trading pattern going back to the start of 2021. Took out first important resistance level, and now needs to hold the breakout.
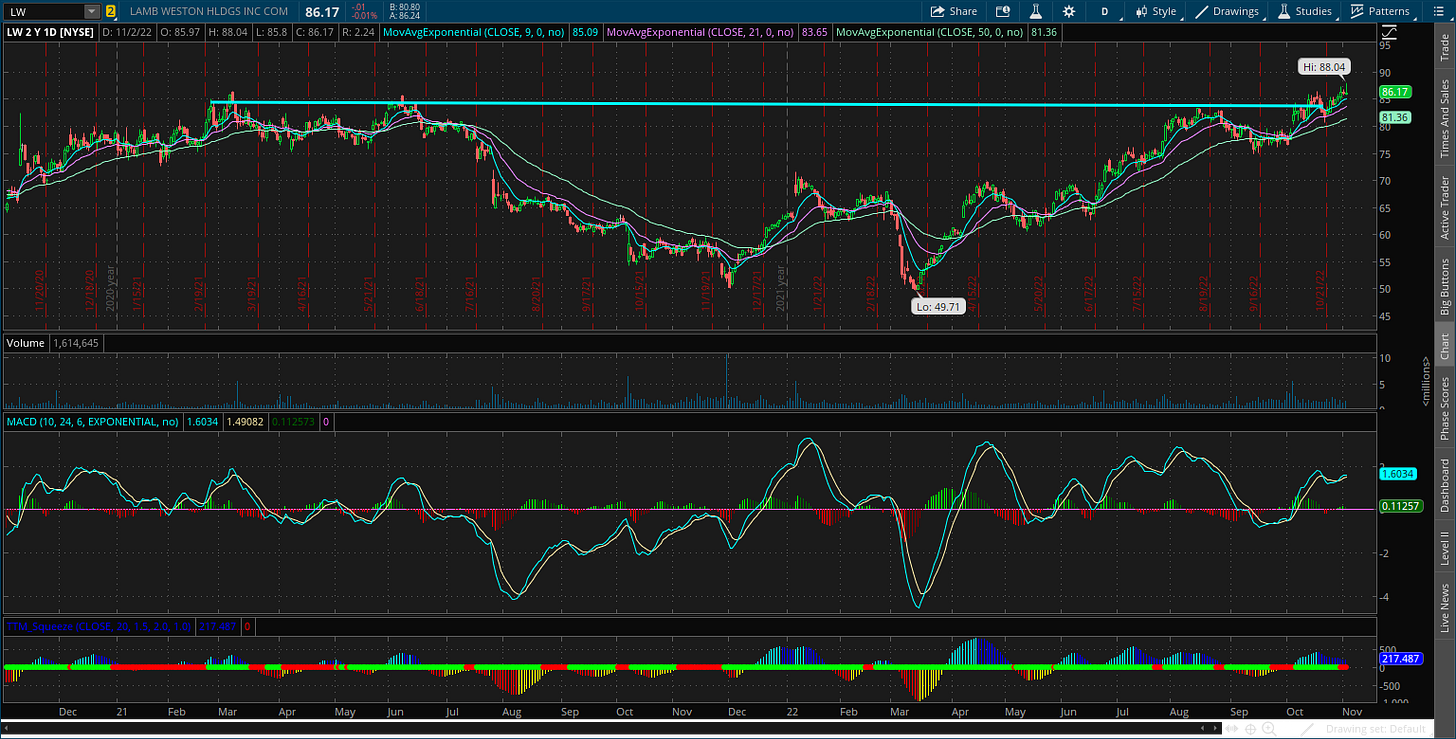
LW
Pattern since start of 2021 has a deeper than ideal structure, but the more shallow consolidation since August now taking out the $85 level following the MACD reset.
NC
Volatile coal stock that’s trying to hold the breakout. Would prefer to see the 21-day MA hold while setting up another run at $60. Position size accordingly with this name.
Short Trade Setups
SNOW
A sustained break of the $150 support level would have me targeting the June lows around $113.
DDOG
Initially the $80 level gave way, then price back tested the breakdown level while creating new short-term support around $75. That support level is now being breached.
SI
Showing the daily chart of this crypto-linked bank to highlight the big support level in play at $50.
S
Tested the $20-21 support level several times since May. Basing period setting up the next move lower on a breakdown of support.
U
Stock broke the bigger trendline, then back tested that resistance level. Now breaking below the $30 trigger level.
FVRR
Found support around $29 in May and has tested that level several times since then. Broke lower and tested the break down level.
Rules of the Game
If you haven’t noticed yet, I trade breakouts! I trade based on the daily chart for long positions. And for price triggers on long setups, I tend to wait until the last half hour of trading to add a position. I find that emotional money trades the open, and smart money trades the close. If it looks like a stock is breaking out, I don’t want a “head fake” in the morning followed by a pullback later in the day.
Also for long positions, I use the 21-day exponential moving average (EMA) as a stop. If in the last half hour of trading it looks like a position will close under the 21-day EMA, I’m usually selling whether it’s to take a loss or book a profit.
For short (or put) positions, I trade off a four-hour chart instead of a daily. Why? There’s a saying that stocks go up on an escalator and down on an elevator. Once a profitable trade starts to become oversold on the four-hour MACD, I start to take gains. Nothing like a short-covering rally to see your gains evaporate quickly, so I’m more proactive taking profits on short positions. I also use a 21-period EMA on the four-hour chart as a stop. If there is a close above the 21-period EMA, I will cover my short.
For updated charts, market analysis, and other trade ideas, give me a follow on twitter: @mosaicassetco
Disclaimer: these are not recommendations and just my thoughts and opinions…do your own due diligence! I may hold a position in the securities mentioned in this newsletter.


Thank you. Very much appreciate your work!
Cheers