Mosaic Chart Alerts
The S&P 500's reaction to CPI is revealing a new phase for stocks.
Welcome back to Mosaic Chart Alerts!
In this newsletter, I’ll focus on the best setups that I’m monitoring for both long and short positions. With a chart and short write-up, this is a quick way to scan and plan potential trades.
These ideas are the end result of my process to identify stocks offering the right combination of fundamentals along with a proper chart setup.
Here are my notes from a shortlist of setups I’m monitoring.
Stock Market Update
In what has become the most highly anticipated economic report every month, we got another look at the Consumer Price Index (CPI) on Tuesday. The inflation metric has developed a reputation for taking investors on a roller coaster ride, like back in October when the S&P 500 traded in a 5.5% range in a single day. That’s why Tuesday’s reaction is all the more remarkable: after the release, stocks finished flat!
It’s remarkable because that’s another sign of normalcy returning to the stock market in 2023. The rally is being driven by the right sectors and participation is broad (i.e. strong breadth). That compares to 2022’s low-quality short covering rallies. Now falling levels of volatility, as evidenced by the reaction to CPI, is another good sign in a couple ways. First, it signals a return to a more normal trading environment where our breakout setups can work better. We’ve seen that with our watchlist this year, where stocks with strong fundamentals and a solid chart setup are breaking out and sustaining their move higher.
Another benefit of falling volatility levels is that it creates a positive feedback loop for stocks to keep moving higher. Institutional funds like risk-parity and volatility-targeting tend to operate under a risk budget when making investment decisions. Greater swings in the stock market forces them to cut back equity exposure. But that works the other way around, where less volatility can draw fund flows back into stocks. We can look at the CBOE Volatility Index (VIX) as a proxy for risk in the chart below. A fall below support around the 18 level could drive another leg higher in the markets. The chart goes back to mid-2020 so you can see the lower volatility market in 2021.
I’m also seeing more breakout patterns setting up, which is another great signal given the run we’ve had this year. To make room for new setups, I’m removing two names from the long watchlist that are recently breaking out from their patterns with ETD and RNGR. I’m adding a new setup that might look a bit different, where I’ve been tracking beaten up stocks with improving fundamentals that are starting to emerge from bottoming patterns.
Keep reading below for all the updates…
Long Trade Setups
CHWY
Carving out a bottoming pattern since May last year, creating a resistance level at $50 in the process. Recent reset in the MACD at the zero line and relative strength (RS) line near 52-week highs.
AVNW
Massive consolidation pattern in the works for nearly two years. Testing support at the $35 level after gapping higher. I would love for the MACD to reset closer to zero before trying to breakout over the $40 level.
BE
Renewable energy stock that peaked two years ago and has tested trendline resistance on three instances. On this recent test, MACD is resetting at the zero line while RS is near the 52-week high. Watching for a move over the $25-$26 area.
SEDG
Trading in a wide range since early 2021. A pause in the rally since mid-October is creating a bullish pennant continuation pattern. Today the stock is breaking out over the $330 area, with a surge in volume the last several trading days.
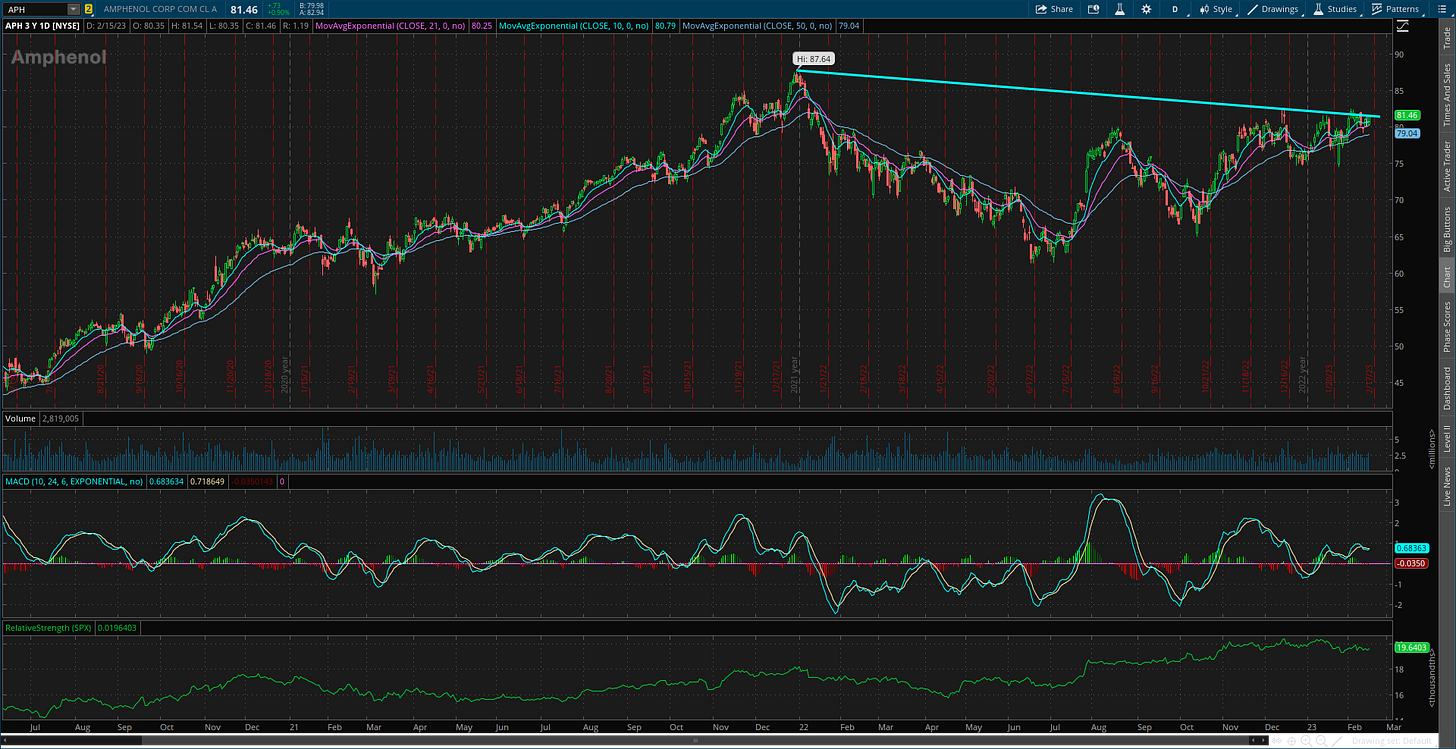
APH
Sitting just below trendline resistance around the $82 level. Recent MACD reset while the RS line is holding near the highs. I expect a breakout would first test the prior high just under $88.
KEYS
Semiconductor stock that today is taking out trendline resistance at the $185 level. The move follows a MACD reset, where a breakout could set up a test of the prior highs around $210.
Short Trade Setups
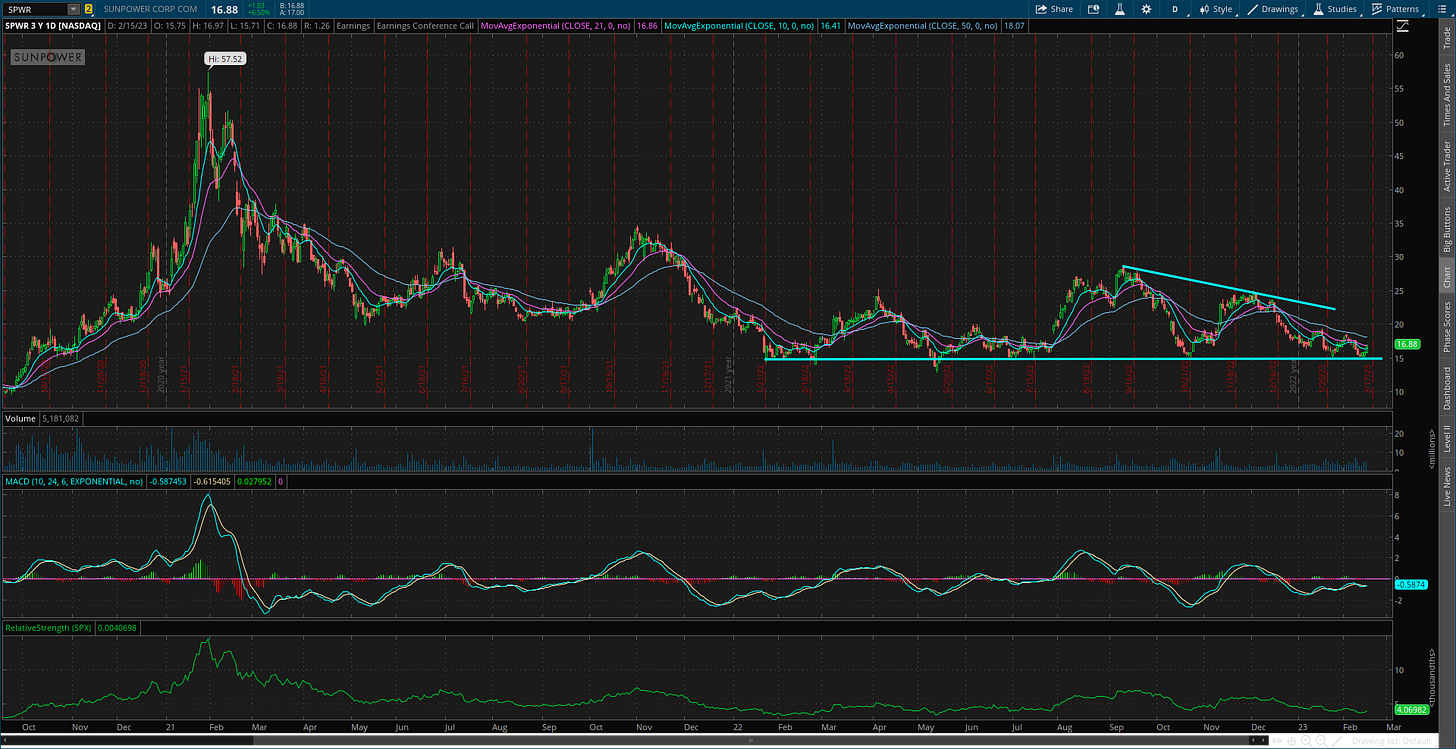
SPWR
Redrawing this setup slightly to target the $15 support level, which was tested again this week. MACD and RS line still in position to support a move lower.
SBOW
Creating a support level around $24 that’s being tested again. Recent reset of the MACD below the zero line and move lower in the relative strength line could see support give way this time.
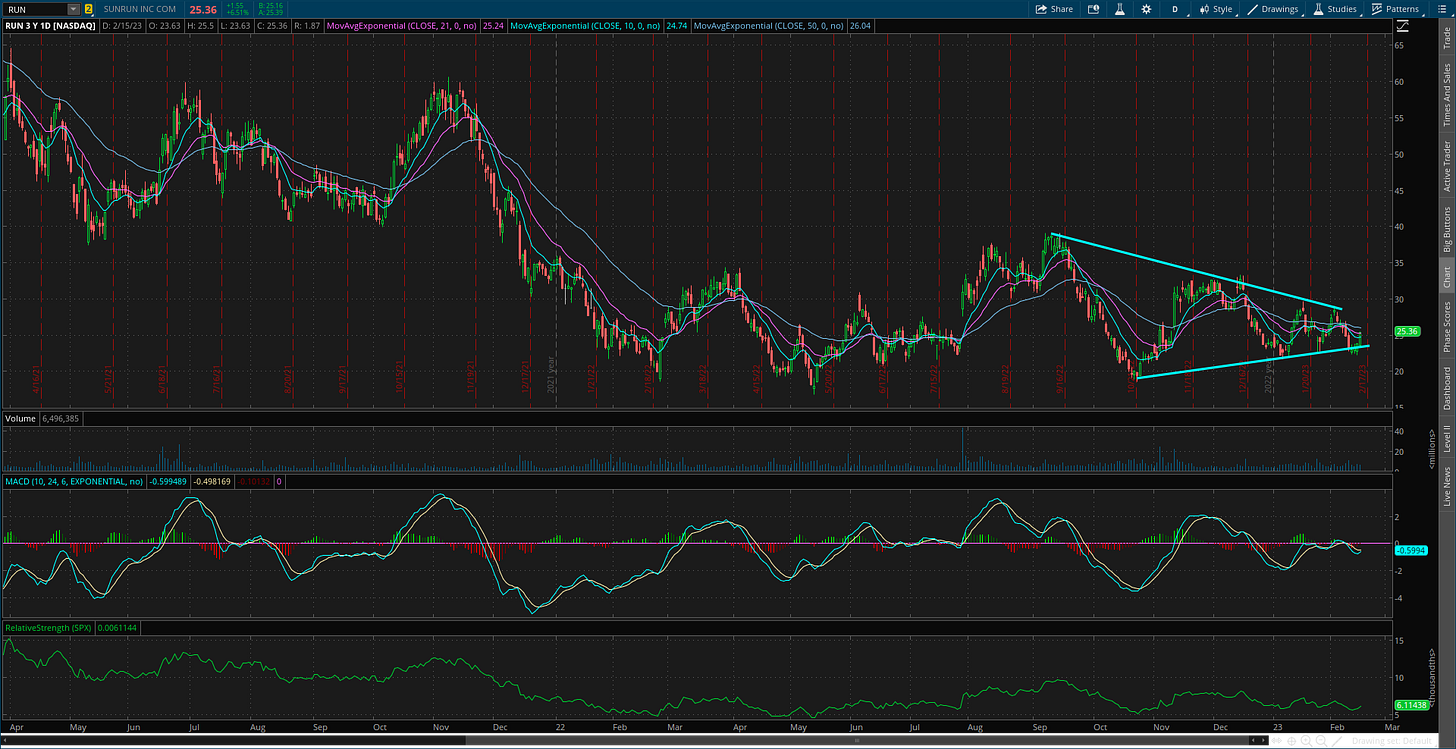
RUN
Creating a bearish triangle continuation pattern. Tested trendline support this week at the $23 level, where I’m watching for a close below.
MOS
Keeping on watch for another week. Still want to see price move back below moving averages and now have MACD turning lower to test support around the $43 level.
Rules of the Game
If you haven’t noticed yet, I trade breakouts! I trade based on the daily chart for long positions. And for price triggers on long setups, I tend to wait until the last half hour of trading to add a position. I find that emotional money trades the open, and smart money trades the close. If it looks like a stock is breaking out, I don’t want a “head fake” in the morning followed by a pullback later in the day.
Also for long positions, I use the 21-day exponential moving average (EMA) as a stop. If in the last half hour of trading it looks like a position will close under the 21-day EMA, I’m usually selling whether it’s to take a loss or book a profit.
For short (or put) positions, I trade off a four-hour chart instead of a daily. Why? There’s a saying that stocks go up on an escalator and down on an elevator. Once a profitable trade starts to become oversold on the four-hour MACD, I start to take gains. Nothing like a short-covering rally to see your gains evaporate quickly, so I’m more proactive taking profits on short positions. I also use a 21-period EMA on the four-hour chart as a stop. If there is a close above the 21-period EMA, I tend to cover my short.
For updated charts, market analysis, and other trade ideas, give me a follow on Twitter: @mosaicassetco
Disclaimer: these are not recommendations and just my thoughts and opinions…do your own due diligence! I may hold a position in the securities mentioned in this newsletter.


