In this post, I’ll focus on setups that I’m monitoring for both long and short positions. With a chart and short write-up, this is a quick way to scan and plan potential trades.
These ideas are the end result of my process to identify stocks offering the right combination of growth fundamentals along with a proper chart setup.
Stock Market Update
Easing tensions in the Middle East is sparking a relief rally that’s sending major stock indexes back near record levels. A symbolic retaliation by Iran was followed by a ceasefire, which is causing a reversal of the initial reaction to the conflict. Oil prices pulled back sharply, the U.S. dollar dropped, and stock indexes are at record highs in some cases. The Nasdaq 100 had a record close this week, while the S&P 500 is less than 1% away from its February peak.
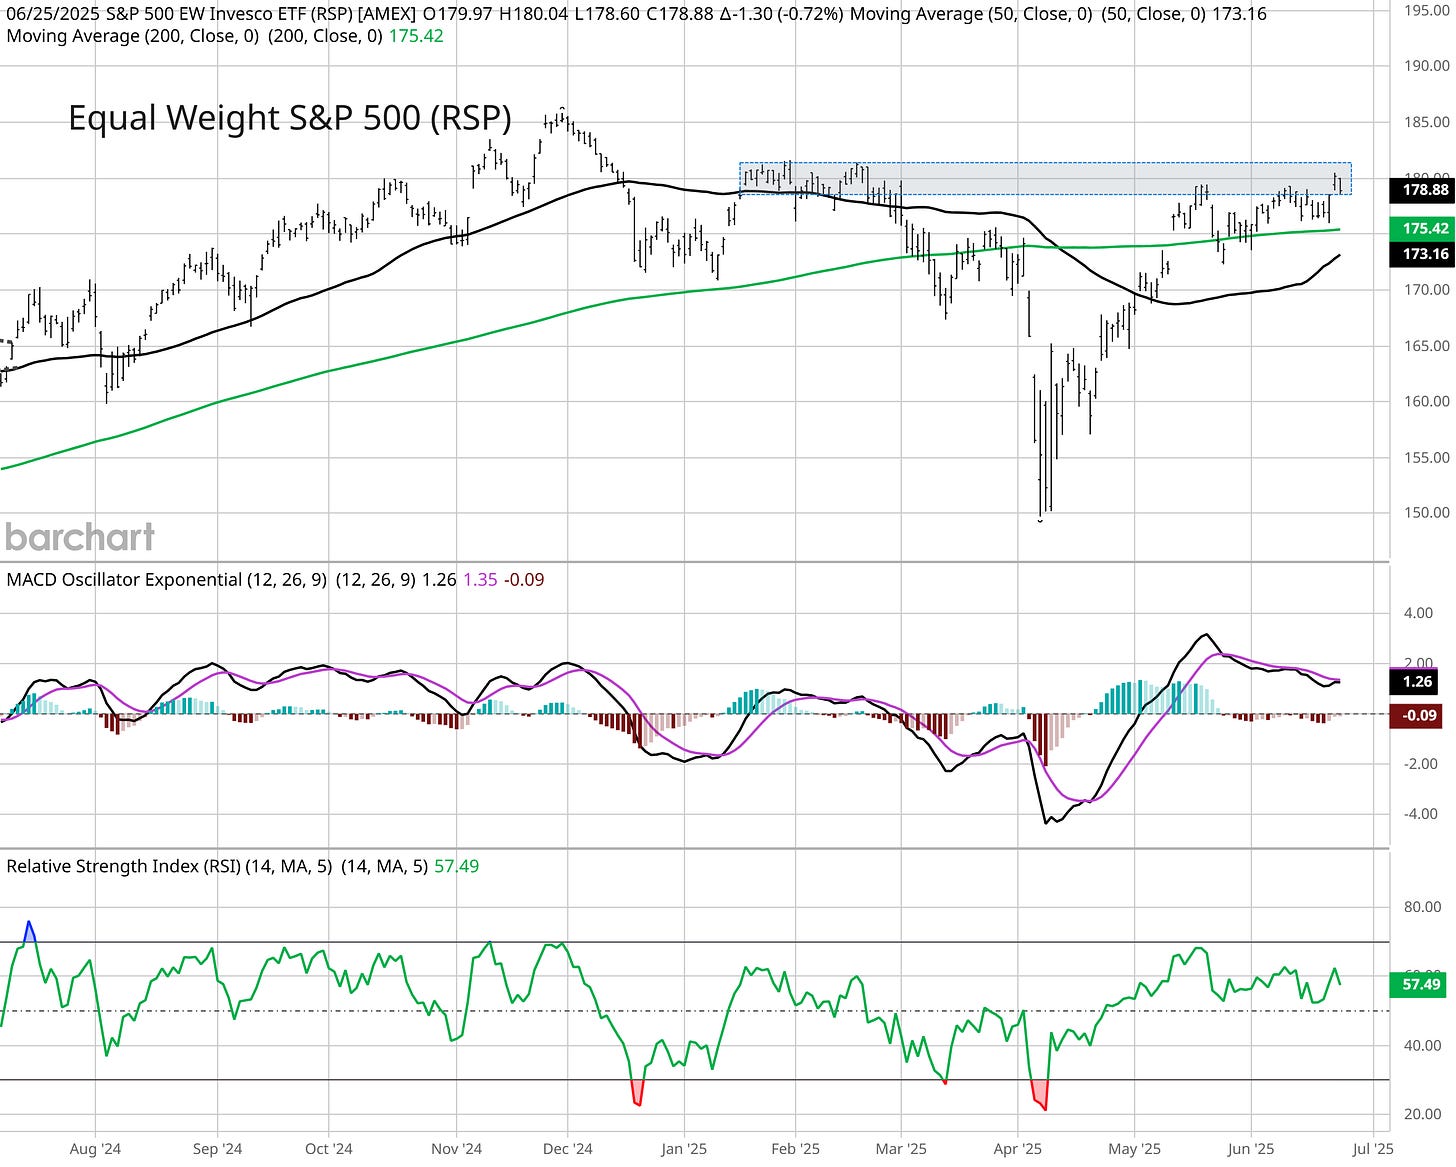
As I noted in this week’s video update posted to Hub members, the S&P 500 and other indexes are recently seeing a correction in time as opposed to price. Choppy and sideways trading action over the past month is relieving many indexes like the S&P 500 and Nasdaq of extremely overbought conditions following the rally off the April lows. The next chart I’m watching is with the average S&P stock. The Invesco S&P 500 Equal Weight ETF (RSP) is trading at resistance around the $180 area shown with the shaded area in the chart below. A break above the range would be a positive signal from the average stock.
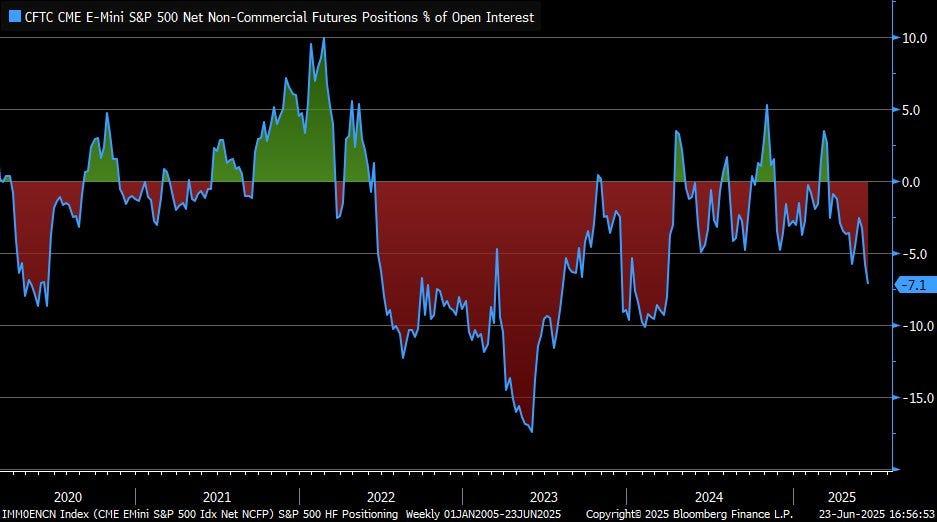
Despite the proximity to prior record high levels, investor sentiment and positioning data are not excessively bullish. The CNN Fear & Greed Index is just crossing into “greed” territory from “neutral”. In the most recent AAII sentiment survey of retail investors, bearish views jumped to 41.4% from 33.6% in the prior week. That’s well above the historical bearish average of 31.0%, and outnumbers the bullish views at 33.2%. By some measures, investor positioning is turning more bearish recently. Net positioning in S&P 500 futures by hedge funds and large speculators is showing an increase in short exposure. Short exposure relative to open interest is the largest since early 2024 (chart below).
The skepticism behind the rally off the April lows has the stock market climbing a wall of worry. Investors that are underexposed to the stock market could remain a source of buying pressure, especially as historically favorable July seasonality is about to kick in. Keep reading to see:
Open ETF positions.
Open stock positions.
Chart analysis for new trade ideas.


