

In this post, I’ll focus on setups that I’m monitoring for both long and short positions. With a chart and short write-up, this is a quick way to scan and plan potential trades.
These ideas are the end result of my process to identify stocks offering the right combination of growth fundamentals along with a proper chart setup. Live alerts are sent to Traders Hub members only.
Stock Market Update
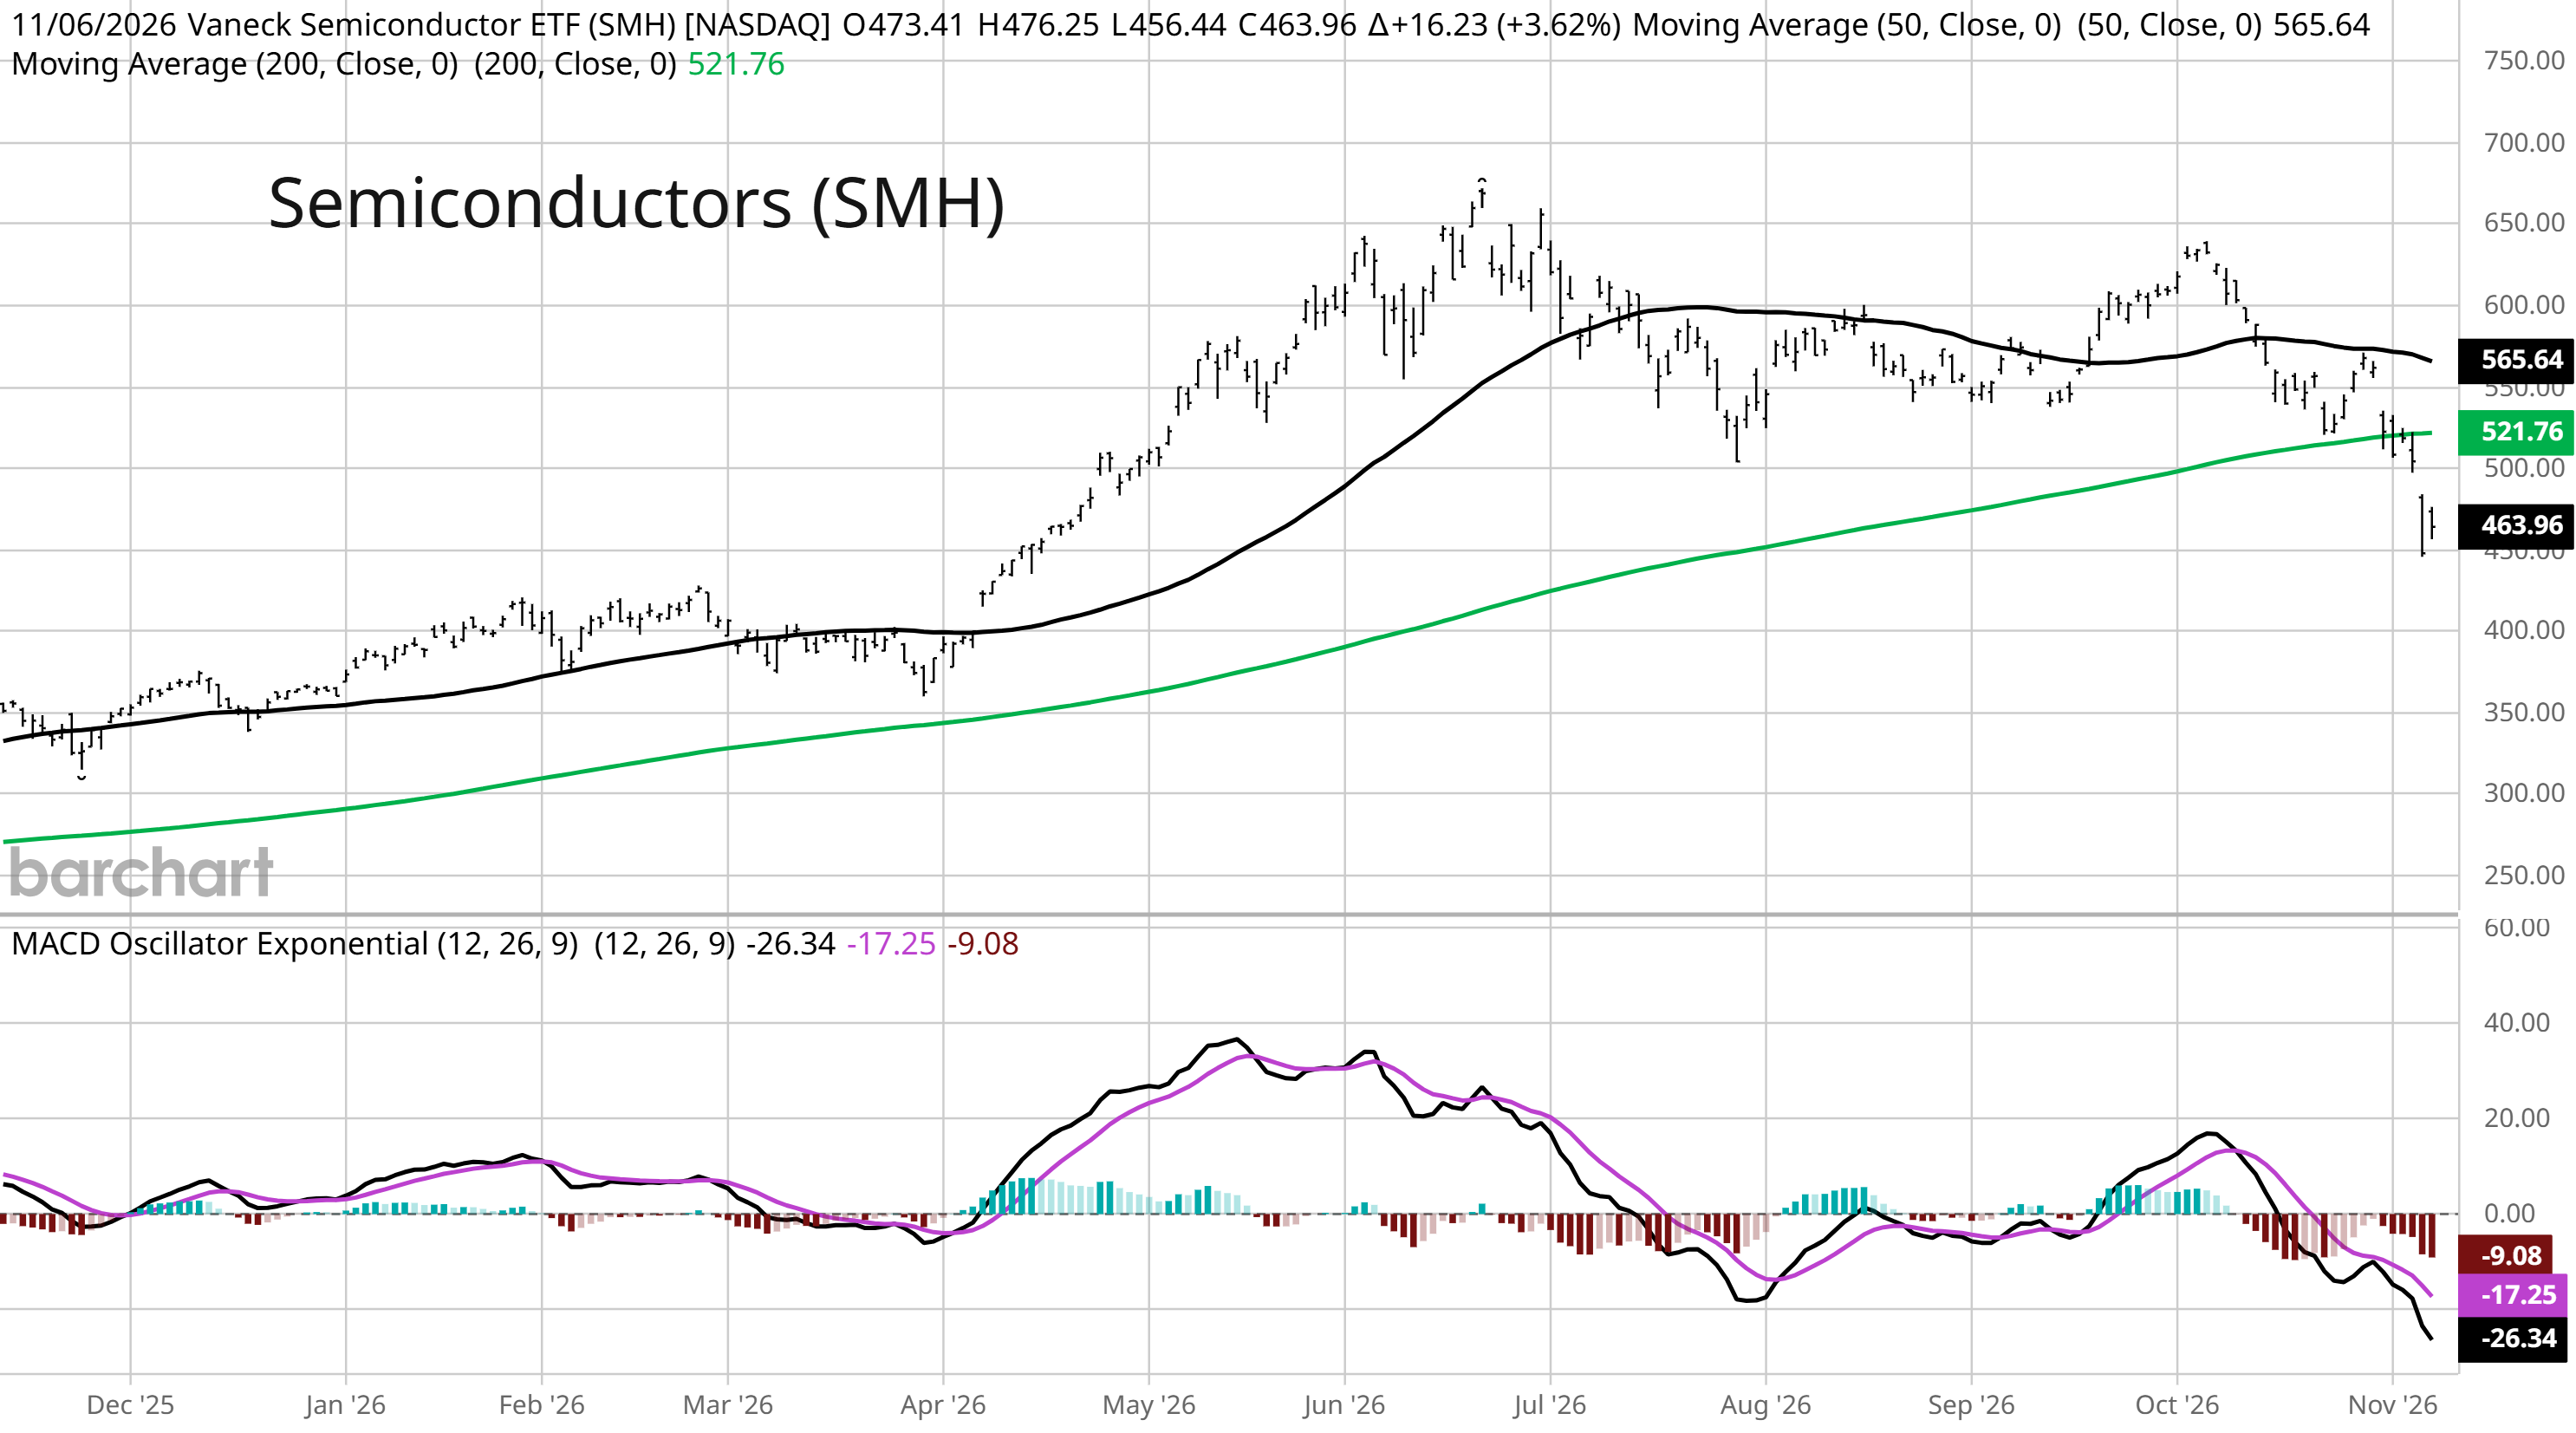
Midterm elections delivered the latest setback for the AI trade while pressure is back on the Federal Reserve to tighten policy at its next meeting. A blue wave means that Democrats are now back in control of both chambers of Congress while winning governorships in states key to the AI infrastructure boom. That includes Texas, where the incoming Democratic governor campaigned on a promise to impose an intermediate-term moratorium on all new data center projects. Approximately 25% of planned data center capacity falls within Texas, where the outlook for continued construction is now uncertain. Growing doubts around the AI regulatory and spending backdrop is the latest setback in the AI trade, which is being felt especially hard in the semiconductor sector. The VanEck Semiconductor ETF (SMH) tracking the industry took out the summer lows and has retraced nearly all the gains from the rally that started in April (chart below).
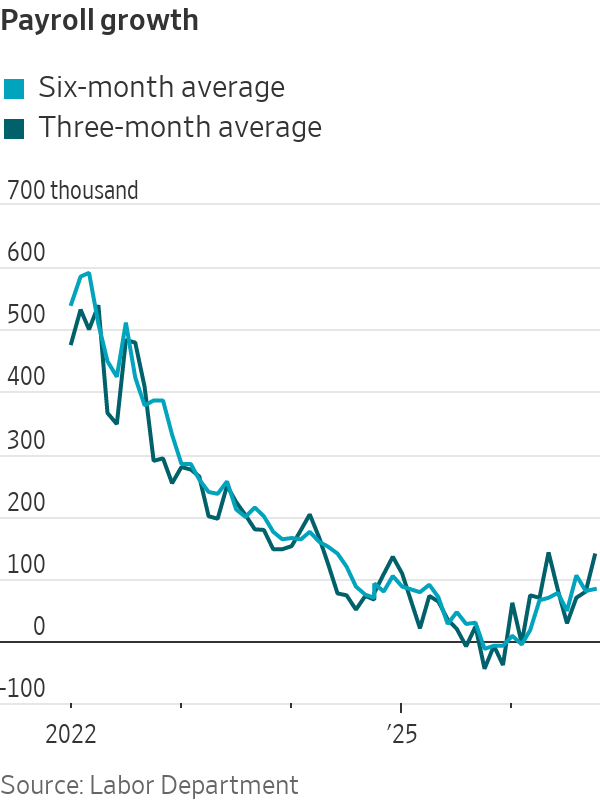
At the same time, financial conditions reflecting the cost and availability of credit could continue tightening with pressure on the Fed to raise rates. Consumer inflation has continued running above target while the October jobs report removed any concerns about a slowdown in the labor market. Payrolls added 165,000 jobs during the month, which smashed expectations for 65,000. While recent months have seen volatility in payrolls figures, smoothed moving averages show job growth trending higher over the past three- and six-months (chart below). Market-implied odds for a December rate hike stand at 84% compared to 66% a month ago.
The pullback in the AI trade is starting to weigh more heavily on cap-weighted indexes with the Nasdaq falling as much as 15% from the October high. But there are growing signs across positioning data that the selloff is getting extreme and that a bottom could be in place. That includes a spike in the equity put/call ratio which jumped over 1.0 and is even higher than during the trade war selloff in April 2025.
We’ve started adding new positions in stocks showing relative strength, including those in biotechnology and payments. Keep reading to see:
Open ETF positions.
Open stock positions.
Chart analysis for new trade ideas.
